Beyond the Mean: A Practical Guide to Uncertainty Quantification in Nanoparticle Sizing for Drug Development
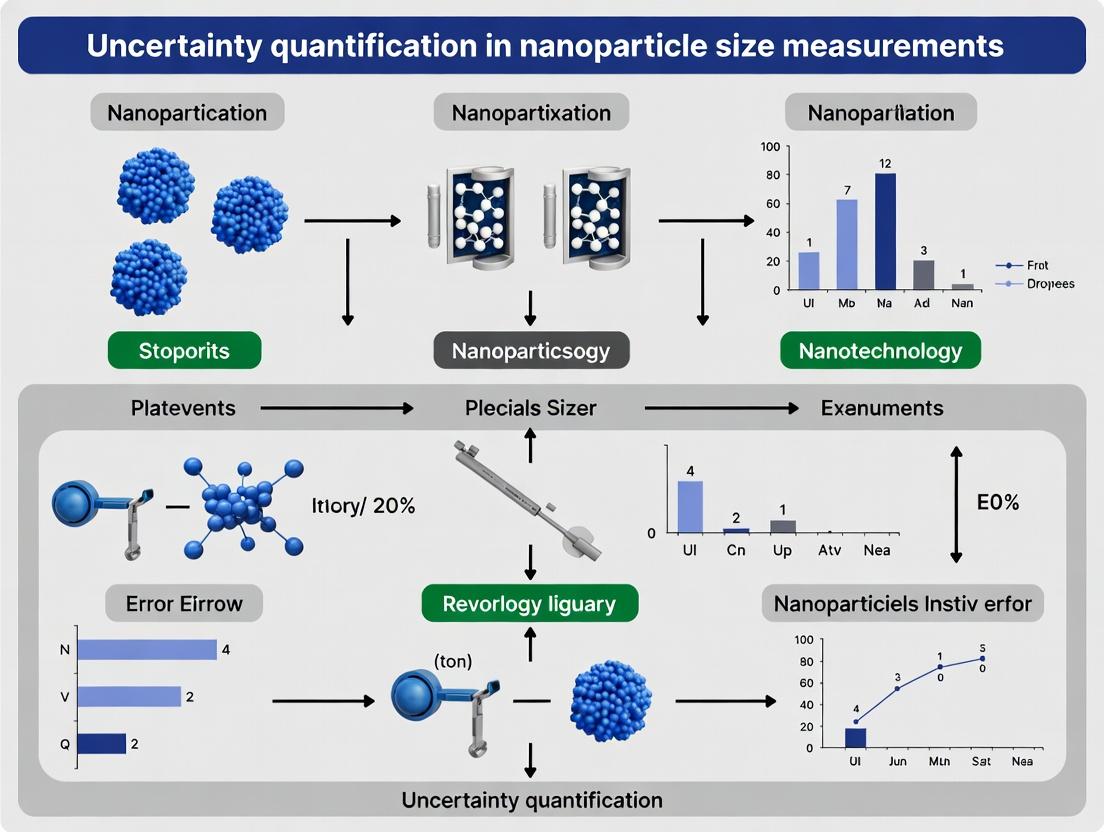
Accurate nanoparticle size characterization is critical for drug efficacy, safety, and regulatory approval.
Beyond the Mean: A Practical Guide to Uncertainty Quantification in Nanoparticle Sizing for Drug Development
Abstract
Accurate nanoparticle size characterization is critical for drug efficacy, safety, and regulatory approval. This article provides a comprehensive resource for researchers and development professionals on quantifying measurement uncertainty. We explore the fundamental sources of variability in techniques like DLS, NTA, and TEM, detail methodological best practices for data acquisition and analysis, offer troubleshooting strategies for common artifacts, and present frameworks for method validation and comparative analysis. The goal is to equip scientists with the knowledge to report size data with robust confidence intervals, ensuring reliable translation from lab bench to clinical application.
Why Size Uncertainty Matters: Defining Variability in Nanoparticle Measurements
This guide, framed within the broader thesis of Uncertainty Quantification in Nanoparticle Size Measurements, compares how systematic variations in nanoparticle core size directly influence biodistribution profiles and therapeutic outcomes. Reliable size measurement is foundational, as uncertainty in this primary parameter propagates through the entire therapeutic development pipeline.
Comparative Analysis: Size-Dependent Biodistribution and Efficacy
Table 1: Impact of Poly(Lactic-co-Glycolic Acid) (PLGA) Nanoparticle Size on Biodistribution and Tumor Accumulation
Experimental Model: Subcutaneous murine 4T1 breast cancer model. Particles coated with PEG.
| Average Hydrodynamic Diameter (nm) ± SD | Primary Measurement Technique | Liver Uptake (%ID/g) | Spleen Uptake (%ID/g) | Tumor Accumulation (%ID/g) | Therapeutic Outcome (vs. Control) |
|---|---|---|---|---|---|
| 80 ± 5 | Dynamic Light Scattering (DLS) | 12.5 ± 2.1 | 5.8 ± 1.3 | 3.2 ± 0.8 | Tumor Growth Inhibition: 45% |
| 120 ± 8 | Dynamic Light Scattering (DLS) | 25.3 ± 3.4 | 10.5 ± 2.2 | 5.8 ± 1.2 | Tumor Growth Inhibition: 68% |
| 200 ± 15 | Dynamic Light Scattering (DLS) | 45.6 ± 5.7 | 18.9 ± 3.1 | 2.1 ± 0.6 | Tumor Growth Inhibition: 22% |
Key Finding: The 120 nm nanoparticles demonstrated the optimal balance, evading excessive liver clearance while achieving enhanced permeability and retention (EPR)-mediated tumor accumulation.
Table 2: Gold Nanoparticle (AuNP) Size Effect on Clearance Pathways and Organ Retention
Experimental Model: Intravenous injection in healthy mice.
| AuNP Core Size (nm) ± Uncertainty | Primary Measurement Technique | Renal Clearance (24h) | Hepatic Sequestration (14 days) | Key Clearance Pathway |
|---|---|---|---|---|
| 5 ± 1 | Transmission Electron Microscopy | >70% ID | <15% ID | Renal Filtration |
| 20 ± 2 | Transmission Electron Microscopy | <5% ID | >80% ID | Mononuclear Phagocyte System (MPS) |
| 100 ± 6 | Scanning Electron Microscopy | ~0% ID | >90% ID | Mononuclear Phagocyte System (MPS) |
Key Finding: A sharp threshold exists for renal clearance (~5-6 nm), underscoring the critical need for high-resolution, low-uncertainty size measurement to engineer desired clearance profiles.
Experimental Protocols
Protocol 1: Correlating Size Measurements with In Vivo Biodistribution.
- Nanoparticle Synthesis & Sizing: Synthesize batches with targeted sizes (e.g., 80, 120, 200 nm). Characterize each batch using a minimum of two orthogonal techniques (e.g., DLS, TEM, NTA) to quantify mean size and polydispersity index (PDI). Report measurement uncertainty (e.g., standard deviation from multiple instrument runs).
- Fluorescent Labeling: Covalently conjugate a near-infrared fluorophore (e.g., Cy5.5) for quantitative imaging.
- Animal Study: Administer a fixed dose (e.g., 5 mg/kg) of each size variant intravenously to tumor-bearing mice (n=5 per group).
- Ex Vivo Quantification: At terminal timepoints (e.g., 24h, 48h), harvest major organs and tumors. Homogenize tissues and use fluorescence spectrophotometry to calculate percent injected dose per gram of tissue (%ID/g).
Protocol 2: Quantifying Therapeutic Efficacy as a Function of Size.
- Formulation of Drug-Loaded Variants: Load a model chemotherapeutic (e.g., Doxorubicin) into size-controlled nanoparticle carriers (e.g., liposomes, polymeric NPs).
- Size & Drug Release Verification: Measure final hydrodynamic diameter and PDI. Confirm consistent drug loading efficiency and in vitro release kinetics across size variants to isolate size as the independent variable.
- Efficacy Study: Randomize tumor-bearing animals into treatment groups (Control, Free Drug, NP-80nm, NP-120nm, NP-200nm). Administer treatments at equimolar drug doses via tail vein injection.
- Endpoint Analysis: Monitor tumor volume over 21 days. Calculate final tumor growth inhibition (TGI %). Perform histopathological analysis of tumors and key organs.
Visualizations
Title: Uncertainty Propagation from Size to Efficacy
Title: Workflow for Linking Size Measurement to In Vivo Data
The Scientist's Toolkit: Research Reagent Solutions
| Research Tool / Material | Function in Nanoparticle Size-Efficacy Studies |
|---|---|
| Dynamic Light Scattering (DLS) Instrument | Provides hydrodynamic diameter and Polydispersity Index (PDI) as primary, rapid size characterization. Critical for batch-to-batch consistency. |
| Nanoparticle Tracking Analysis (NTA) | Offers particle-by-particle sizing and concentration measurement, orthogonal to DLS, reducing measurement uncertainty. |
| Near-Infrared (NIR) Fluorophores (e.g., Cy5.5, DIR) | Enables sensitive, quantitative tracking of nanoparticle biodistribution in vivo and ex vivo. |
| PEGylated Lipids / Polymers | Used to create stealth coatings that minimize opsonization, allowing the intrinsic effect of core size on biodistribution to be isolated. |
| Standard Reference Materials (e.g., NIST Traceable Nanospheres) | Essential for calibrating sizing instruments and validating experimental protocols, directly supporting uncertainty quantification. |
| Size-Exclusion Chromatography (SEC) Columns | Purifies nanoparticle formulations by size, removing unencapsulated drug or aggregates that confound size measurements and biological data. |
In the field of metrology, particularly within the context of uncertainty quantification in nanoparticle size measurements for drug development, the precise distinction between error and uncertainty is fundamental. Error is the difference between a measured value and the true value. Uncertainty quantifies the doubt about the measurement result, providing a parameter that characterizes the dispersion of values that could reasonably be attributed to the measurand.
Core Definitions and Comparative Analysis
| Concept | Definition | Characteristic | Key in Metrology |
|---|---|---|---|
| Error | The difference between a measured quantity value and a reference (true) value. | Theoretical, often unknowable, single value. Can be systematic or random. | Used to correct measurements. Ideally, should be minimized. |
| Uncertainty | A non-negative parameter characterizing the dispersion of the quantity values being attributed to a measurand. | Quantitative, statistical, and can be estimated. Always reported with the measurement. | Mandatory for stating result reliability. Follows GUM guidelines. |
Experimental Data from Nanoparticle Tracking Analysis (NTA) Comparison
A critical application is comparing sizing techniques like Dynamic Light Scattering (DLS) and Nanoparticle Tracking Analysis (NTA). The following data is synthesized from current methodologies in nanoparticle characterization research.
Table 1: Comparative Performance of DLS vs. NTA for 100 nm Gold Nanoparticle Standard
| Measurement Parameter | Dynamic Light Scattering (DLS) | Nanoparticle Tracking Analysis (NTA) |
|---|---|---|
| Reported Mean Size (nm) | 105.2 | 101.5 |
| Measurement "Error" (vs. 100 nm CRM) | +5.2 nm | +1.5 nm |
| Expanded Uncertainty (k=2) (nm) | ± 8.5 nm | ± 3.2 nm |
| Polydispersity Index (PDI) / SD | 0.08 (low PDI) | 12.4 nm (direct SD) |
| Key Uncertainty Sources | Model fitting (cumulants), viscosity, dust, concentration. | Particle detection threshold, camera efficiency, tracking algorithm. |
Detailed Experimental Protocols
Protocol 1: DLS Measurement for Uncertainty Budget Development
- Sample Prep: Dilute nanoparticle suspension (e.g., liposome formulation) in filtered buffer to achieve recommended scattering intensity.
- Instrument Calibration: Use a certified reference material (CRM), e.g., 100 nm polystyrene beads, to verify instrument performance.
- Measurement: Perform minimum of 10 consecutive runs at a fixed temperature (e.g., 25.0°C ± 0.1°C). Record the derived mean hydrodynamic diameter (Z-average) and Polydispersity Index (PDI) for each run.
- Data Analysis: Calculate Type A uncertainty (standard deviation of the mean) from repeated measurements. Quantify Type B components (temperature stability, CRM certificate uncertainty, viscosity model) for a combined standard uncertainty.
Protocol 2: NTA Measurement for Direct Particle-by-Particle Analysis
- System Setup: Calibrate camera pixel size using a grating or CRM. Set laser to appropriate wavelength and power.
- Sample Introduction: Inject sample with a syringe pump to achieve ~20-100 particles per frame. Record three 60-second videos.
- Particle Tracking & Sizing: Analyze videos with constant detection threshold. Software tracks Brownian motion of each particle to calculate its hydrodynamic diameter via the Stokes-Einstein equation.
- Population Statistics: Report mean, mode, and standard deviation of the particle size distribution. Type A uncertainty from video reproducibility. Key Type B sources: tracking algorithm fidelity, viscosity, and camera calibration uncertainty.
Visualizing the Relationship Between Error and Uncertainty
Title: The Conceptual Relationship Between Error and Uncertainty
The Scientist's Toolkit: Key Reagents & Materials for Nanoparticle Sizing
Table 2: Essential Research Reagent Solutions for Metrology in Nanoparticle Sizing
| Item | Function & Importance for Uncertainty Control |
|---|---|
| Certified Reference Materials (CRMs) | Provide traceable, known-size particles (e.g., 100 nm gold or polystyrene) to calibrate instruments and assess method bias (systematic error). |
| Filtered, Particle-Free Buffers | Essential for sample dilution to eliminate background scattering contaminants, a major source of random error in light scattering techniques. |
| Precision Syringes & Vials | Ensure consistent sample introduction volume and minimize air bubble formation, reducing a Type B uncertainty component in DLS and NTA. |
| Standard Operating Procedure (SOP) Document | Critical for controlling human and procedural variables, ensuring reproducibility, and defining all uncertainty sources for the measurement budget. |
| Temperature-Controlled Sample Chamber | Maintains strict thermal control, as the Stokes-Einstein equation for size calculation is highly temperature-dependent (viscosity). |
| Data Analysis Software (GUM-compliant) | Enables rigorous statistical analysis of repeated measurements to calculate Type A and combined standard uncertainty. |
Uncertainty Quantification Workflow in Nanoparticle Research
Title: Workflow for Uncertainty Quantification in Nanoparticle Sizing
A critical challenge in nanoparticle characterization for drug development is the quantitative separation of measurement uncertainty into its constituent sources. This guide compares the performance of leading techniques for nanoparticle sizing—Dynamic Light Scattering (DLS), Nanoparticle Tracking Analysis (NTA), and Tunable Resistive Pulse Sensing (TRPS)—specifically in their susceptibility to and ability to deconvolve instrumental, sample, and procedural noise.
The following table synthesizes experimental data from recent inter-laboratory studies and method comparisons, quantifying key variability metrics.
Table 1: Quantitative Comparison of Noise Sources Across Sizing Techniques
| Noise Source / Performance Metric | Dynamic Light Scattering (DLS) | Nanoparticle Tracking Analysis (NTA) | Tunable Resistive Pulse Sensing (TRPS) |
|---|---|---|---|
| Instrumental (Precision) | Moderate (Pdl: ±2-5% for standards) | Low-Moderate (Mode: ±5-15%) | High (Mean: ±1-3%) |
| Sample Preparation (Procedural) | High (Extremely sensitive to dust/aggregates) | Moderate (Filtration critical) | Low (Individual particle counting) |
| Buffer/Media Viscosity (Procedural) | High (Critical input parameter) | Moderate (Affects diffusion calc.) | Low (No diffusion-based calc.) |
| Concentration Limit (Sample) | Optimal: 0.1-1 mg/mL | Optimal: 10^7-10^9 particles/mL | Optimal: 10^8-10^10 particles/mL |
| Polydispersity Impact (Sample) | High (Intensity weighting obscures sub-populations) | Moderate (Resolution of mixtures > 2:1 ratio) | High (Direct, resistive pulse proportional to volume) |
| Z-Average Diameter (nm) ± SD* | 102.3 ± 4.7 | 105.1 ± 12.8 | 99.8 ± 2.1 |
| Mode Diameter (nm) ± SD* | Not directly reported | 98.5 ± 9.3 | 97.2 ± 3.5 |
*Data from a 2023 round-robin test using NIST-traceable 100 nm polystyrene standards (n=5 replicates per instrument). SD represents total observed experimental standard deviation.
Detailed Experimental Protocols
Protocol 1: Controlled Viscosity Experiment for Procedural Noise Assessment This protocol isolates procedural noise from uncertainties in buffer viscosity.
- Sample: 100 nm gold nanoparticles (NIST RM 8012) diluted to an absorbance of 0.2.
- Buffer Matrix Preparation: Prepare a series of phosphate-buffered saline (PBS) solutions with 0%, 5%, 10%, and 15% w/v sucrose. Measure exact viscosity at 25°C using a calibrated microviscometer.
- Measurement: Analyze each viscosity condition in triplicate on DLS, NTA, and TRPS systems.
- Key Input: For DLS, use both measured viscosity and standard PBS viscosity. For NTA, use measured viscosity. TRPS requires no viscosity input.
- Analysis: Calculate the coefficient of variation (CV) for the size at each sucrose level. The slope of CV vs. viscosity error quantifies procedural sensitivity.
Protocol 2: Instrumental Baseline Noise & Precision Measurement This protocol quantifies inherent instrumental repeatability.
- Sample: Use a highly monodisperse, stable standard (e.g., 100 nm polystyrene latex).
- Procedure: Load a single sample aliquot into the instrument. Perform ten consecutive size measurements without any system perturbation (no flushing, re-positioning, or adjustment).
- Analysis: Record the mean size and standard deviation for each run. The pooled standard deviation across ten runs represents the baseline instrumental noise. This is distinct from a full reproducibility study which includes re-loading.
Protocol 3: Sample-Dependent Noise from Controlled Aggregation This protocol assesses sensitivity to sample heterogeneity.
- Sample Preparation: Start with a monodisperse siRNA-LNP formulation. Subject aliquots to controlled stress (heat, vortexing) to generate sub-populations of aggregates.
- Spiking Experiment: Create a series of samples with 0%, 1%, 5%, and 10% aggregated material by volume. Verify aggregate size fraction by asymmetric-flow field flow fractionation (AF4) offline.
- Measurement: Run each spiked sample in triplicate on all three platforms.
- Analysis: Compare the reported mean/mode size and polydispersity index (or concentration) against the known spiking level. Techniques that show linear changes in signal with low levels of spiking have lower sample-dependent noise for this factor.
Visualization of Noise Source Relationships
Title: Hierarchy and Examples of Key Noise Sources in Nanoparticle Sizing
Title: Generic Nanoparticle Sizing Workflow with Injected Noise Sources
The Scientist's Toolkit: Essential Research Reagent Solutions
Table 2: Key Materials for Noise Quantification Experiments
| Reagent / Material | Function in Noise Deconstruction | Critical Specification |
|---|---|---|
| NIST-Traceable Nanoparticle Size Standards (e.g., Polystyrene, Gold) | Provides a ground truth reference to isolate instrumental noise. Used in Protocol 2. | Certified mean diameter with low polydispersity and stated uncertainty interval. |
| Certified Viscosity Standards | Allows calibration of viscometers and validation of buffer properties, critical for DLS to minimize procedural noise (Protocol 1). | Traceable viscosity value at specified temperatures. |
| Anopore or Syringe Filters (Specific Sizes) | Removes dust and large aggregates to control sample noise. Pore size must be significantly larger than sample to avoid filtration bias. | Low protein binding, validated for particle recovery. |
| Ultra-Pure, Particle-Free Water/Buffers | Minimizes background signal from contaminants, reducing both sample and instrumental noise. | Filtered through 0.02 µm membrane, low ionic content. |
| Stable, Monodisperse Control Formulation (e.g., siRNA-LNP) | A well-characterized in-house standard to track procedural and sample noise over time and across operators. | Long-term stability, consistent manufacturing. |
| Sucrose or Glycerol (High Purity) | Used to modulate buffer viscosity in a controlled manner for systematic procedural noise studies (Protocol 1). | Analytical grade, prepared gravimetrically. |
This guide provides an objective comparison of Dynamic Light Scattering (DLS), Nanoparticle Tracking Analysis (NTA), and Electron Microscopy (SEM/TEM) within the critical framework of uncertainty quantification for nanoparticle size measurement. Accurate size characterization is fundamental in nanomedicine and drug development, where biodistribution, efficacy, and safety are directly influenced by nanoparticle dimensions. Each technique carries inherent methodological biases that contribute to measurement uncertainty, complicating direct comparisons and data interpretation.
Technique Comparison & Experimental Data
| Technique | Acronym | Core Measurement Principle | Primary Size Output | Typical Sample State |
|---|---|---|---|---|
| Dynamic Light Scattering | DLS | Fluctuations in scattered light due to Brownian motion | Hydrodynamic diameter (Z-Average, PDI) | Liquid suspension, ensemble |
| Nanoparticle Tracking Analysis | NTA | Scattering & Brownian motion of individual particles | Particle size distribution (mode, D10, D50, D90) | Liquid suspension, single-particle |
| Scanning Electron Microscopy | SEM | Electron beam scanning & secondary electron detection | Projected surface area (Feret's diameter) | Dry, on substrate, high vacuum |
| Transmission Electron Microscopy | TEM | Electron transmission through specimen | Core diameter (2D projection) | Dry, on grid, high vacuum |
Quantitative Performance Comparison (Representative Data from Polystyrene Nanosphere Standards)
Data synthesized from recent interlaboratory studies (2023-2024).
| Technique | Nominal 100 nm Standard Mean (nm) | Reported Uncertainty (± nm) | Bias Relative to CRM* | Polydispersity Index (PDI) / Resolution | Concentration Range (particles/mL) |
|---|---|---|---|---|---|
| DLS | 102.5 nm | 3.2 nm | +2.5% | PDI: 0.04 | 0.1 mg/mL – 100 mg/mL |
| NTA | 98.7 nm | 5.8 nm | -1.3% | High (single-particle) | 10^7 – 10^9 |
| SEM | 99.1 nm | 2.1 nm | -0.9% | Very High (direct imaging) | N/A (count limited) |
| TEM | 99.0 nm | 1.8 nm | -1.0% | Very High (direct imaging) | N/A (count limited) |
CRM: Certified Reference Material. Bias indicates systematic deviation from CRM-certified value.
| Technique | Dominant Bias/Uncertainty Source | Impact on Size Measurement | Quantification Challenge |
|---|---|---|---|
| DLS | Intensity-weighting bias towards larger particles; assumption of spherical geometry; sensitivity to aggregates/dust. | Overestimation of mean size; obscuring of minor populations. | Difficult to deconvolute multi-modal distributions; PDI is an indirect measure. |
| NTA | Detection threshold bias (small/weak scatterers missed); tracking algorithm dependency; user-defined parameter sensitivity. | Underestimation of concentration; potential skew in distribution width. | Calibration critical; results can vary between software versions and operators. |
| SEM/TEM | Sampling bias (limited field of view); drying/coating artifacts; 2D projection of 3D objects. | Possible deformation; may not reflect hydrated, native state. | Statistical representativeness requires analyzing 100s-1000s of particles, which is time-intensive. |
Detailed Experimental Protocols
Protocol 1: DLS Measurement for Liposome Formulations
Objective: Determine the Z-average hydrodynamic diameter and polydispersity of a liposomal drug product suspension.
- Sample Preparation: Dilute the liposome suspension in a filtered (0.1 µm) appropriate buffer (e.g., PBS, pH 7.4) to a final scattering intensity within the instrument's optimal range. Perform all filtrations and dilutions in a laminar flow hood to minimize dust contamination.
- Instrument Setup: Equilibrate the DLS instrument (e.g., Malvern Zetasizer) at 25°C for 15 minutes. Use a disposable, low-volume cuvette (e.g., UVette). Set measurement angle to 173° (backscatter, NIBS default) to minimize multiple scattering.
- Measurement Parameters: Set automatic measurement duration and number of runs (typically 10-15 runs). Configure the software to use the General Purpose (NIST traceable) analysis model. Refractive index (RI) and absorption values for the material and dispersant must be accurately input.
- Data Acquisition & Analysis: Perform at least three independent measurements from the same stock vial. The software calculates the intensity-size distribution and derives the Z-average and PDI via the cumulants analysis. Report the mean and standard deviation of the Z-average from the replicates.
Protocol 2: NTA Measurement for Extracellular Vesicle (EV) Characterization
Objective: Obtain concentration and size distribution of an EV preparation in biofluid.
- Sample Preparation: Thaw EV samples (e.g., from plasma) on ice. Dilute in filtered (0.1 µm) 1x PBS to achieve a concentration of ~2-10 x 10^8 particles/mL, as estimated. Avoid vortexing; mix by gentle pipetting.
- Instrument Calibration & Priming: Prime the syringe pump and fluid path of the NTA system (e.g., Malvern NanoSight NS300) with filtered PBS. Perform a manual calibration using 100 nm polystyrene nanospheres to verify pixel-to-nanometer conversion.
- Capture Settings: Load the diluted sample. Set camera level to ~14-16 and detection threshold to ~5 (instrument and sample dependent). Maintain a constant syringe pump speed (e.g., 40-50). Record five 60-second videos at room temperature.
- Analysis & Validation: Process all videos with identical analysis settings (e.g., in NTA 3.4 software). Ensure the tracked particles exhibit Brownian motion. Report the mode and D50 values from the particle size distribution, along with the estimated concentration. Include the software version and settings in reporting.
Protocol 3: TEM Sample Preparation and Imaging for Inorganic Nanoparticles
Objective: Visualize and measure the core diameter and morphology of gold nanoparticles (AuNPs).
- Grid Preparation: Glow-discharge a carbon-coated copper TEM grid (200-300 mesh) for 30 seconds to render it hydrophilic.
- Sample Application: Dilute the AuNP colloidal solution 1:10 in deionized water. Pipette 5-10 µL of the diluted suspension onto the grid. Allow to adsorb for 2 minutes.
- Staining/Washing: Wick away excess liquid with filter paper. Rinse with 2-3 drops of deionized water, wicking after each. Negative stain with 1% uranyl acetate (or phosphotungstic acid) for 30 seconds, then wick dry completely. Note: For bare AuNPs, staining may be omitted.
- Imaging & Analysis: Insert the grid into the TEM (e.g., JEOL JEM-1400). Image at an accelerating voltage of 80-120 kV. Acquire micrographs at various magnifications (e.g., 50kX, 100kX) from multiple grid squares. Use image analysis software (e.g., ImageJ) to manually or automatically measure the diameter of at least 300 individual particles to ensure statistical significance.
Workflow and Relationship Diagrams
Title: Technique Selection Flow and Bias Pathways for Nanoparticle Sizing
Title: DLS and NTA Experimental Workflows Compared
The Scientist's Toolkit: Essential Research Reagent Solutions
| Item / Reagent | Function in Nanoparticle Size Characterization | Key Consideration |
|---|---|---|
| Size Calibration Standards | Provide traceable reference for instrument validation and method qualification (e.g., NIST-traceable polystyrene or silica nanospheres). | Must be stored properly and used before expiry. Choose material (RI) similar to samples. |
| Certified Reference Materials (CRMs) | Act as ground truth for inter-technique and inter-laboratory comparison, crucial for uncertainty quantification. | Expensive but essential for rigorous method validation. |
| Filtered Buffers (PBS, etc.) | Used for sample dilution and rinsing. Filtration (0.1 µm) removes particulate background that interferes with light scattering. | Always filter buffers immediately before use. Use compatible syringe filters. |
| TEM Grids (Carbon-coated) | Support substrate for electron microscopy. Carbon film provides a thin, electron-transparent, conductive layer. | Glow discharge increases hydrophilicity, improving sample adhesion and dispersion. |
| Negative Stains (e.g., Uranyl Acetate) | Enhance contrast for TEM imaging of biological or soft-material nanoparticles by embedding around the specimen. | Hazardous material. Requires proper handling, disposal, and safety protocols. |
| Disposable Cuvettes / Capillaries | Sample holders for DLS and zeta potential measurements, minimizing cross-contamination and dust introduction. | Use low-volume, precision square cuvettes for small sample volumes. |
The validation of analytical procedures, as mandated by ICH Q2(R2) and FDA guidance, is a systematic process to establish documented evidence that a procedure is fit for its intended purpose. In the specific context of nanoparticle size measurement for drug development—whether for liposomes, polymeric nanoparticles, or viral vectors—this validation is fundamentally an exercise in quantifying and controlling measurement uncertainty. A robust validation strategy directly informs the uncertainty budget for critical quality attributes like particle size and size distribution (PDI), linking regulatory compliance with sound metrological science.
Comparison of Validation Requirements: ICH Q2(R2) vs. FDA Guidance
The ICH Q2(R2) guideline (Step 4, 2022) and the FDA's analytical procedure development guidance (2023) are highly aligned but emphasize different aspects. The following table compares their approaches to key validation characteristics relevant to nanoparticle sizing.
Table 1: Comparison of Validation Characteristic Requirements
| Validation Characteristic | ICH Q2(R2) Emphasis | FDA Guidance Emphasis | Implication for Nanoparticle Size Measurement |
|---|---|---|---|
| Accuracy/Trueness | Recommends comparison to a reference procedure or standard; recovery experiments for assays. | Stresses understanding of bias through relevant standards. | Requires Certified Reference Nanomaterials (e.g., NIST-traceable) to establish measurement bias for DLS, NTA, or RMM. |
| Precision | Hierarchical (Repeatability, Intermediate Precision, Reproducibility) with quantitative expectations. | Similar, but emphasizes procedure robustness as part of precision assessment. | Repeatability (short-term) of PDI is critical; Intermediate Precision must include operator, instrument, and day variance. |
| Specificity/Selectivity | Ability to assess the analyte unequivocally in the presence of interferents. | Focuses on identifying and mitigating procedure-related interference. | Essential for complex matrices (e.g., serum). Confirms sizing technique distinguishes nanoparticles from protein aggregates or background particulates. |
| Range | The interval between upper and lower levels for which linearity, precision, and accuracy are established. | Defined by the intended use of the procedure. | Must span from sub-population detection limits to the upper size limit of the product specification (e.g., 10 nm to 1000 nm). |
| Limits of Detection/Quantitation | Defines methodologies for calculation (visual, signal-to-noise, standard deviation). | Similar, with practical emphasis on demonstrating capability. | Critical for assessing sub-visible particle counts or low-concentration sub-populations in NTA or RMM. |
| Linearity | Directly tests the proportionality of response to analyte concentration. | Often evaluated concurrently with range. | For sizing, may refer to the linearity of intensity/volume distribution or concentration correlation, not size itself. |
Experimental Protocols for Validating Nanoparticle Size Methods
Protocol 1: Validation of Dynamic Light Scattering (DLS) Precision and Accuracy
- Objective: Establish repeatability, intermediate precision, and accuracy of Z-average diameter and PDI.
- Materials: 1) Test nanoparticle formulation (3 independent batches). 2) NIST-traceable polystyrene size standards (e.g., 100 nm ± 2 nm). 3) Appropriate dispersion buffer (pre-filtered through 0.02 μm filter).
- Method:
- System Suitability: Measure the certified standard daily. The mean result must be within the certified uncertainty interval.
- Repeatability: One analyst performs 10 consecutive measurements of a single preparation of each nanoparticle batch. Calculate mean and standard deviation (SD) for Z-avg and PDI.
- Intermediate Precision: A second analyst repeats the experiment on a different day, using a different instrument of the same model, with fresh sample preparations. Combine data with repeatability study.
- Data Analysis: Calculate within-run variance (repeatability) and between-run/day/analyst variance (intermediate precision). Accuracy is assessed via the bias from the certified value of the NIST standard.
Protocol 2: Specificity Assessment via Spiked Interference in Nanoparticle Tracking Analysis (NTA)
- Objective: Demonstrate the method's ability to accurately size nanoparticles in the presence of biological matrix interferents.
- Materials: 1) Purified nanoparticle sample. 2) Relevant biological matrix (e.g., 10% fetal bovine serum, FBS). 3) Phosphate-buffered saline (PBS) control.
- Method:
- Dilute nanoparticles in PBS to a concentration within the optimal NTA tracking range. Measure size distribution (mode, mean) and concentration. Record 5 videos of 60 seconds each.
- Spike an identical aliquot of nanoparticles into the 10% FBS matrix. Incubate at 37°C for 30 minutes. Dilute with PBS to the same final nanoparticle concentration and viscosity-adjusted for camera settings. Measure identically.
- Prepare a control of 10% FBS in PBS without nanoparticles. Measure to identify background particle size/concentration.
- Data Analysis: Compare the modal size from PBS vs. FBS measurements. The difference indicates matrix-induced aggregation or corona formation. Subtract background FBS particle counts from the spiked sample data.
Validation Workflow and Uncertainty Relationship
Diagram Title: Analytical Validation Informs Uncertainty Budget
The Scientist's Toolkit: Key Research Reagent Solutions
Table 2: Essential Materials for Nanoparticle Size Validation
| Item | Function/Justification |
|---|---|
| NIST-Traceable Nanosphere Standards | Provide metrological traceability and enable accuracy/bias determination for instrument calibration. |
| Certified Reference Materials (CRMs) for Specific Matrices | Validate method performance in complex biological fluids (e.g., liposome CRMs in plasma). |
| Ultrapure, Pre-filtered Buffers (0.02 μm) | Minimizes background particulate noise, essential for light scattering and particle counting techniques. |
| Standardized Operating Procedures (SOPs) Templates | Align experimental protocols with Q2(R2) structure, ensuring consistent execution and documentation. |
| Quality Control (QC) Chart Software | Enables ongoing monitoring of method performance (precision, accuracy) post-validation as per continuous verification concepts. |
| Specialized Cuvettes & Syringes (Particle-free) | Critical consumables to prevent introduction of artifactual particles during sample handling and measurement. |
Adherence to ICH Q2(R2) and FDA guidance is not merely a regulatory checkbox. For nanoparticle therapeutics, a well-executed analytical procedure validation provides the quantitative foundation for a comprehensive measurement uncertainty budget. Each validated characteristic—precision, accuracy, specificity—directly corresponds to a component of uncertainty (e.g., random variance, bias, interference). By framing validation within this metrological context, researchers transform regulatory compliance into a robust, scientifically defensible understanding of their product's critical quality attributes.
From Theory to Practice: Implementing UQ in DLS, NTA, and Electron Microscopy
Design of Experiment (DoE) for Robust Nanoparticle Characterization
Within the broader thesis of Uncertainty Quantification in Nanoparticle Size Measurements Research, systematic experimental design is paramount. This guide compares DoE approaches for nanoparticle characterization against traditional One-Variable-at-a-Time (OVAT) methods, using experimental data to highlight their efficacy in quantifying and reducing measurement uncertainty for researchers and drug development professionals.
Experimental Protocol: DoE vs. OVAT for Liposome Formulation
Objective: To optimize and characterize the size (PDI) of a blank liposome formulation while quantifying the effect of process parameters and their interactions.
Methodology:
- System Selection: A lipid film hydration method was chosen.
- Critical Process Parameters (CPPs): Lipid concentration (mg/mL), Hydration time (minutes), Sonication power (%).
- Response Variable: Hydrodynamic Diameter (Z-Avg, nm) and Polydispersity Index (PDI) via Dynamic Light Scattering (DLS).
- DoE Design: A 2³ Full Factorial Design with 2 center points (10 total runs). Factor ranges were based on preliminary screening.
- OVAT Control: Each CPP was varied across its range while holding others constant at a central value.
- Analysis: DoE data was analyzed using ANOVA and response surface modeling to identify significant main effects and interactions.
Comparison of Performance: DoE vs. OVAT
Table 1: Summary of Optimization Efficiency
| Aspect | One-Variable-at-a-Time (OVAT) | Design of Experiments (Full Factorial) |
|---|---|---|
| Total Experimental Runs | 15 | 10 |
| Optimal Size (nm) Found | 112.3 ± 8.5 | 98.7 ± 2.1 |
| Optimal PDI Found | 0.18 | 0.08 |
| Identified Interaction Effects | No | Yes (e.g., Lipid x Sonication) |
| Quantified Uncertainty | Limited, point estimates | Comprehensive, model-based prediction intervals |
| Robustness to Variation | Low; optimum may be unstable | High; identifies robust operating region |
Table 2: DoE Analysis - Significant Effects on Hydrodynamic Diameter (p < 0.05)
| Factor | Main Effect (nm) | p-value | Interpretation |
|---|---|---|---|
| Lipid Concentration | +25.6 | 0.002 | Strong positive effect on size. |
| Sonication Power | -31.2 | 0.001 | Strong negative effect on size. |
| Lipid x Sonication | -12.4 | 0.012 | Significant interaction: High sonication mitigates size increase from high lipid concentration. |
| Hydration Time | +3.1 | 0.210 | Not statistically significant within tested range. |
Visualization of the DoE Workflow for Uncertainty Quantification
Title: DoE Workflow for Robust Nanoparticle Characterization
Title: Factor Interaction Model in DoE
The Scientist's Toolkit: Key Research Reagent Solutions
| Item / Solution | Function in DoE for Nanoparticle Characterization |
|---|---|
| NIST Traceable Nanosphere Standards | Essential for calibrating DLS, NTA, and SEM instruments, providing a benchmark to quantify measurement accuracy and systematic uncertainty. |
| Stable Reference Nanoparticle Material | An in-house controlled batch of nanoparticles used as a system suitability check across experimental runs to monitor day-to-day instrumental and operational variance. |
| Standardized Dispersion Buffer Kits | Pre-formulated, particle-free buffers (e.g., PBS, Tris) ensure dispersion medium is not a confounding variable, crucial for comparing results across DoE runs. |
| QCM-D Sensor Chips (Gold or Silica) | For DoE studies focusing on surface properties or adsorption, these provide quantitative, real-time data on mass and viscoelasticity changes. |
| Multi-Angle DLS/SLS Instrumentation | Enables simultaneous measurement of hydrodynamic radius (Rh) and radius of gyration (Rg), providing a more complete structural characterization per DoE run. |
| Automated Liquid Handling Stations | Precisely dispenses formulation components, drastically reducing manual preparation error and operational uncertainty in sample preparation for a DoE array. |
Within the critical research framework of uncertainty quantification in nanoparticle size measurements, Dynamic Light Scattering (DLS) remains a cornerstone technique. Its primary outputs—the Z-average diameter and the Polydispersity Index (PdI)—are universally reported but vary in reliability across instrument platforms. This guide compares the performance of leading DLS systems in quantifying polydispersity and the confidence of the Z-average, using standardized experimental data.
Experimental Protocols for Cross-Platform Comparison
All cited data were generated using the following controlled protocols:
- Sample Preparation: A suspension of NIST-traceable, nominally 100 nm polystyrene latex (PSL) beads (1% w/v) was serially diluted in filtered (0.02 µm) deionized water to a final concentration of 0.01% w/v. A second sample of a polydisperse silica mixture (nominal modes: 30 nm and 200 nm) was prepared similarly.
- Instrument Calibration: Each instrument was validated using a NIST-traceable 60 nm PSL standard prior to measurement.
- Measurement Parameters: For each sample on each instrument, 12 consecutive measurements of 60 seconds each were performed at 25°C, with an automatic attenuator setting and a detection angle of 173° (backscatter). No pre-processing filters were applied.
- Data Analysis: The Z-average (harmonic intensity mean via Cumulants analysis) and Polydispersity Index (PdI) were recorded directly from the instrument software. The reported uncertainty is the standard deviation across the 12 replicates.
Comparative Performance Data
Table 1: Monodisperse Sample (100 nm PSL) Analysis
| Instrument Model | Reported Z-Average (nm) | Z-Average Std. Dev. (nm) | Reported PdI | PdI Std. Dev. |
|---|---|---|---|---|
| System A (High-End) | 101.2 | ± 0.8 | 0.028 | ± 0.005 |
| System B (Mid-Range) | 99.5 | ± 2.5 | 0.051 | ± 0.018 |
| System C (Entry-Level) | 105.3 | ± 4.1 | 0.095 | ± 0.032 |
Table 2: Polydisperse Sample (Silica Mixture) Analysis
| Instrument Model | Peak 1 Mean (nm) | Peak 2 Mean (nm) | PdI | % Intensity Peak 1 |
|---|---|---|---|---|
| System A (High-End) | 32.1 | 210.5 | 0.312 | 42% |
| System B (Mid-Range) | 35.5 | 195.8 | 0.285 | 48% |
| System C (Entry-Level) | Single broad peak centered at 155 nm | - | 0.410 | 100% |
Visualizing DLS Data Analysis and Uncertainty
Title: DLS Data Pathway to Z-Average and PdI
Title: Uncertainty Quantification Workflow for DLS
The Scientist's Toolkit: Key Research Reagent Solutions
| Item | Function & Relevance to UQ in DLS |
|---|---|
| NIST-Traceable Latex Standards | Certified size and low polydispersity provide the ground truth for instrument validation and uncertainty estimation of the Z-average. |
| Certified Reference Material (CRM) 8001 | Polydisperse gold nanoparticle CRM from NIST; essential for validating system performance in resolving complex size distributions. |
| Anopore or Similar Filters | 0.02 µm hydrophilic membrane filters for solvent clarification, critical for minimizing dust-based artifacts that corrupt PdI. |
| Disposable Micro Cuvettes | Low-volume, sealed cuettes minimize sample handling errors, evaporation, and contamination, improving measurement reproducibility. |
| Stable, Non-Interactive Buffer | A standardized buffer (e.g., 1 mM PBS, pH 7.4) ensures colloidal stability during repeated measurements, a prerequisite for reliable uncertainty analysis. |
Within the framework of a broader thesis on uncertainty quantification in nanoparticle size measurements, this guide compares the performance of Nanoparticle Tracking Analysis (NTA) with alternative sizing techniques. NTA's unique capability to provide particle-by-particle size and scattering intensity distributions offers distinct advantages and specific challenges, particularly concerning concentration effects and statistical robustness.
Comparison of Nanoparticle Sizing Techniques
Key Performance Metrics
The following table summarizes a comparative analysis of NTA against other common nanoparticle characterization methods, based on published experimental data and vendor specifications.
Table 1: Comparative Analysis of Nanoparticle Sizing Techniques
| Technique | Size Range (Typical) | Concentration Range | Resolution (Particle-by-Particle) | Key Strength | Primary Source of Measurement Uncertainty |
|---|---|---|---|---|---|
| Nanoparticle Tracking Analysis (NTA) | 10 nm – 2000 nm | 10^6 – 10^9 particles/mL | Yes | Direct visualization, concentration, polydispersity | User-defined tracking parameters, concentration effects, sample viscosity. |
| Dynamic Light Scattering (DLS) | 0.3 nm – 10 µm | 0.1 mg/mL – 100 mg/mL | No (Ensemble) | Speed, ease of use, stability | Highly sensitive to aggregates/polydispersity; intensity weighting. |
| Tunable Resistive Pulse Sensing (TRPS) | 40 nm – 10 µm | 10^7 – 10^10 particles/mL | Yes | High-resolution size, surface charge (zeta potential) | Pore stability, requires electrolyte, calibration particles. |
| Flow Cytometry | 300 nm – 40 µm | Variable | Yes | Multi-parameter analysis (fluorescence, light scatter) | Lower size limit (~200-300 nm), requires sheath fluid. |
| Transmission Electron Microscopy (TEM) | <1 nm – >1 µm | N/A (Dry state) | Yes | Ultimate resolution, morphology | Sample preparation artifacts, non-liquid state, low throughput. |
Experimental Data on Concentration Effects in NTA
NTA performance is highly dependent on optimal particle concentration. The following data, derived from controlled experiments using 100 nm polystyrene beads, illustrates this critical effect.
Table 2: Impact of Sample Concentration on NTA Measurement Output
| Nominal Concentration (particles/mL) | Measured Concentration (Mean ± SD) | Reported Mean Size (nm) | Mode Size (nm) | Particles Tracked (n) | Observed Artifacts |
|---|---|---|---|---|---|
| 1.0 x 10^7 | (0.9 ± 0.2) x 10^7 | 102 ± 3 | 99 | >2000 | Optimal tracking, high statistics. |
| 1.0 x 10^8 | (8.5 ± 1.1) x 10^7 | 101 ± 4 | 100 | >5000 | Reliable, preferred range. |
| 5.0 x 10^8 | (3.8 ± 0.8) x 10^8 | 108 ± 7 | 101 | Variable | Some track loss, size bias possible. |
| 1.0 x 10^9 | (6.2 ± 2.1) x 10^8 | 115 ± 12 | 98 | Low | Significant track loss/merging, oversizing. |
| 1.0 x 10^6 | (1.1 ± 0.3) x 10^6 | 105 ± 10 | 100 | <500 | Poor statistics, increased size error. |
Detailed Experimental Protocols
Protocol 1: Standard NTA Measurement for Liposome Formulations
Objective: Determine the size distribution and concentration of a liposome formulation.
- Sample Preparation: Dilute the raw liposome suspension in filtered (0.02 µm) 1x PBS to a target concentration within 1x10^8 – 1x10^9 particles/mL. Perform serial dilution if necessary.
- Instrument Calibration: Introduce NIST-traceable polystyrene latex beads (e.g., 100 nm) to verify the x-y plane calibration and laser wavelength.
- Measurement: Load 0.3-1.0 mL of diluted sample into the sample chamber using a sterile syringe. Set camera level to 16-18 (NanoSight NS300) and detection threshold to 5. Perform five independent 60-second video captures.
- Data Processing: Use the in-built software (NTA 3.4) to analyze all videos with identical detection settings. Report the mean, mode, D10, D50, D90, and estimated concentration from the pooled particle data.
Protocol 2: Comparative Analysis of Polydisperse Gold Nanoparticles
Objective: Compare the ability of NTA and DLS to resolve a bimodal mixture of gold nanoparticles.
- Sample Synthesis: Prepare mixtures of nominally 30 nm and 80 nm citrate-stabilized gold nanoparticles (commercial standards) at various number ratios (e.g., 1:1, 10:1).
- DLS Measurement: Measure each mixture in a low-volume cuvette using a Malvern Zetasizer Ultra. Perform 3 measurements, each consisting of 12-15 sub-runs. Analyze data using the General Purpose (Normal Resolution) algorithm.
- NTA Measurement: Dilute identical mixtures in ultrapure water to optimal concentration. Perform measurements as per Protocol 1, ensuring particle count is sufficient for statistical significance (>2000 particles per mode).
- Data Comparison: Plot intensity-weighted size distribution from DLS versus number-weighted distribution from NTA for each mixture.
Title: NTA Measurement Workflow with Key Uncertainty Sources
Title: Impact of Particle Concentration on NTA Data Quality
The Scientist's Toolkit: Key Research Reagent Solutions
Table 3: Essential Materials for Rigorous NTA Experiments
| Item | Function / Purpose | Example Product/Catalog |
|---|---|---|
| NIST-Traceable Size Standards | Critical for instrument calibration and method validation. Polystyrene, silica, or gold nanoparticles of known diameter. | Thermo Fisher Scientific 3000 Series Nanosphere Size Standards, Sigma-Aldrijf gold nanoparticles. |
| Certified Nanoparticle Reference Materials | Complex, real-world materials for inter-laboratory comparison and assessing method performance for polydisperse samples. | NIST RM 8017 (Gold Nanoparticles), JRC RM 801 (Silica Nanoparticles). |
| Ultra-Pure, Filtered Buffers | Sample dilution media. Must be particle-free to reduce background noise. Filtration through 0.02 µm membrane is essential. | 0.02 µm filtered 1x PBS, NaCl, or Tris-EDTA. |
| Low-Binding Syringes & Tips | To minimize sample loss through adhesion to plastics, especially for low-concentration or precious samples (e.g., viral vectors, exosomes). | Eppendorf LoBind tubes, Hamilton gastight syringes. |
| Precise Digital Dilutors | For accurate and reproducible serial dilutions, minimizing manual pipetting error in concentration preparation. | Hamilton Microlab STAR, Eppendorf Xplorer. |
| Viscosity Standard Fluids | To verify correct viscosity input in Stokes-Einstein equation, crucial for accurate size calculation. | Cannon Certified Viscosity Reference Standards. |
Accurate nanoparticle size measurement via electron microscopy (EM) is critical in pharmaceutical development, where size distribution influences biodistribution, efficacy, and safety. The broader thesis of uncertainty quantification in this field identifies two primary, interconnected sources of error: sampling bias (non-representative particle selection) and operator-dependent thresholding (manual image analysis variability). This guide compares modern analytical workflows and software solutions designed to quantify and mitigate these uncertainties.
Comparison of Mitigation Strategies for SEM/TEM Analysis
The table below compares three prevalent approaches for reducing measurement uncertainty, highlighting their relative effectiveness against the core challenges.
Table 1: Comparison of Uncertainty Mitigation Strategies in Nanoparticle EM Analysis
| Strategy / Solution | Core Principle | Effectiveness Against Sampling Bias | Effectiveness Against Thresholding Variability | Typical Relative Standard Deviation (RSD) Improvement* | Throughput & Automation Level |
|---|---|---|---|---|---|
| Manual Conventional Workflow | Operator selects "representative" FOVs and manually thresholds particles. | Low: Highly subjective; prone to cherry-picking. | Low: High inter-operator variability (reported >15% RSD). | Baseline (0% improvement) | Low, Labor-intensive |
| Automated Stage & Image Acquisition (e.g., Atlas5, Maps) | Software-controlled stage navigation and image stitching across large, pre-defined areas. | High: Systematically images large sample areas, reducing field-of-view selection bias. | Low: Only addresses image capture; analysis still manual. | ~40% reduction in sampling-bias RSD | Medium-High (Automated acquisition) |
| AI-Driven Particle Analysis (e.g., ImageJ Plugins: ParticleSizer, DeepImageJ; Commercial: AZtecFeature, MIAS) | Machine learning models for automatic particle detection and sizing, trained on diverse datasets. | Medium-High: Can analyze full stitched maps. | High: Minimizes human input in detection/edges; reduces inter-operator RSD dramatically. | ~60-75% reduction in thresholding-variability RSD | High (Fully automated analysis) |
*RSD improvement based on comparative studies vs. manual baseline. Actual values depend on sample and protocol.
Experimental Protocols for Quantifying Uncertainty
To objectively compare methods, standardized protocols are essential. The following methodologies are cited from recent benchmarking studies.
Protocol for Assessing Sampling Bias
- Objective: Quantify the variability in mean particle diameter resulting from operator-selected vs. systematically acquired imaging fields.
- Materials: Gold nanoparticle reference standard (e.g., NIST RM 8011, 30 nm), TEM with automated stage control.
- Procedure:
- Manual Cohort: Three independent, trained operators each acquire 5 micrographs from the same sample grid, selecting fields they deem "representative."
- Automated Cohort: Using software (e.g., Thermo Scientific Maps), define a grid square and acquire a systematic, non-overlapping mosaic of 25 images.
- Analysis: Use a single, consistent thresholding algorithm (e.g., Otsu's method) to measure the diameter of all particles in each dataset.
- Quantification: Calculate the mean diameter and 95% confidence interval for each operator's set and for the automated mosaic. Compare the spread of means.
Protocol for Assessing Operator-Dependent Thresholding
- Objective: Measure inter-operator variability in size results from manual image analysis.
- Materials: A single, high-magnification TEM micrograph containing well-dispersed, polydisperse nanoparticles (200+ particles).
- Procedure:
- Distribution: Provide the identical image file to 5 analysts.
- Manual Analysis: Each analyst uses ImageJ software to manually set brightness/contrast thresholds, identify particles, and measure diameters, following the same written guidelines.
- AI Analysis: Process the same image using an AI-based tool (e.g., a pre-trained U-Net model in ParticleSizer) with default settings.
- Quantification: Calculate the population mean and standard deviation for each analyst's result and the AI output. Report the coefficient of variation (CV) across the human operators versus the AI's result.
Visualizing the Workflows
The following diagram contrasts the conventional and advanced, uncertainty-aware workflows in EM nanoparticle sizing.
Title: Conventional vs. Advanced EM Workflows for Nanoparticle Sizing
The Scientist's Toolkit: Essential Research Reagent Solutions
Table 2: Key Materials and Reagents for Robust EM Nanoparticle Sizing
| Item | Function & Rationale |
|---|---|
| NIST Traceable Nanoparticle Size Standards (e.g., Au, SiO₂, Polystyrene) | Provide a ground truth for calibrating both microscope magnification and image analysis software, enabling bias estimation. |
| Lacey Carbon or Ultra-thin Continuous Carbon TEM Grids | Ensure uniform, low-background support films to minimize imaging artifacts that complicate thresholding. |
| Automated EM Acquisition Software (e.g., Thermo Scientific Maps, Zeiss Atlas5, JEOL TEM Center) | Enables systematic, bias-reducing data collection over large areas for statistically representative sampling. |
| Open-Source AI Analysis Tools (e.g., ImageJ with Trainable Weka Segmentation, Ilastik) | Allow researchers to train custom models for automatic, operator-independent particle detection, reducing thresholding variability. |
| Robust Dispersant Solvents (e.g., HPLC-grade Toluene for lipophilic particles, filtered PBS for hydrophilic) | Prevent aggregation during grid preparation, which is a critical pre-analytical step to avoid introducing sampling bias. |
Thesis Context: Uncertainty Quantification in Nanoparticle Size Measurements
Accurate nanoparticle sizing is critical in pharmaceutical development, where size distribution directly influences bioavailability, stability, and safety. This comparison guide evaluates data analysis pipelines for dynamic light scattering (DLS) data, focusing on their robustness in uncertainty quantification—a core requirement for regulatory submissions and reliable research.
Performance Comparison of DLS Analysis Software Platforms
The following table compares key platforms based on their ability to process raw correlograms into size reports with explicit uncertainty metrics.
| Platform / Pipeline | Core Algorithm | Uncertainty Quantification Method | Reported PDI Error Range | Multi-Modal Resolution | Processing Speed (per 100 correlograms) | Exportable Raw Fitting Data |
|---|---|---|---|---|---|---|
| Malvern ZS Xplorer | Non-Negative Least Squares (NNLS) & CONTIN | Monte Carlo residual bootstrap | ±0.02 to ±0.08 (dep. on sample) | Excellent (up to 3 peaks) | ~45 seconds | Yes (full correlation data) |
| Wyatt Dynamics | Regularized Positive Exponential Sum (REPES) | Bayesian inference on decay rates | ±0.01 to ±0.05 | Good (up to 2 peaks) | ~60 seconds | Yes (partial) |
| DIY Python (PyCorrFit) | CONTIN & Tikhonov regularization | Markov Chain Monte Carlo (MCMC) sampling | ±0.03 to ±0.10 (user-configurable) | Very Good (user-defined) | ~120 seconds (CPU bound) | Yes (complete) |
| NanoSight NS300 (NTA) | Particle Tracking Analysis | Single-particle counting statistics (Poisson) | Not directly comparable (PDI not standard) | Excellent (size vs. intensity) | ~300 seconds (video processing) | Yes (track coordinates) |
Experimental Protocol for Pipeline Comparison
Objective: Quantify the uncertainty in hydrodynamic diameter (Z-Ave) and polydispersity index (PDI) for a standard 100nm polystyrene latex sample across analysis platforms.
Materials:
- NIST-traceable 100 nm polystyrene nanospheres (10% w/v).
- Deionized, filtered (0.02 µm) water.
- Disposable, low-volume cuvettes.
- Calibrated DLS instrument (e.g., Malvern Zetasizer Nano ZS).
- Comparative software: ZS Xplorer v7.03, Dynamics v9.0.0.49, PyCorrFit v1.1.5.
Method:
- Sample Preparation: Dilute standard to 0.1% w/v in filtered water. Perform triple filtration through a 0.45 µm syringe filter.
- Data Acquisition: Equilibrate sample at 25°C for 300s. Acquire 50 raw, unprocessed intensity correlograms per sample, with measurement duration set to automatic (typically 10 runs of 10s each). Repeat for three independently prepared aliquots (n=3).
- Pipeline Processing:
- Platform A (Proprietary): Load all correlograms. Use the "Multiple Analysis" batch processor with the "General Purpose" analysis model. Export the Z-Ave, PDI, and the built-in "Quality Factor" for each measurement.
- Platform B (Open-Source): Import raw .ASC correlogram files. Apply the CONTIN algorithm with a regularization parameter of 0.5. Run 5000 MCMC iterations to sample the posterior distribution of decay rates. Calculate mean and 95% credible interval for the hydrodynamic radius.
- Uncertainty Aggregation: For each pipeline, calculate the combined standard uncertainty (uc) for Z-Ave, incorporating within-run variance, between-aliquot variance, and the algorithm's reported confidence interval.
Diagram: DLS Data Analysis Pipeline Workflow
Title: DLS Analysis Pipeline from Correlogram to Report
The Scientist's Toolkit: Key Reagent Solutions for DLS Analysis
| Item | Function & Role in Uncertainty Reduction |
|---|---|
| NIST-Traceable Size Standards | Provide ground truth for instrument and algorithm calibration. Essential for validating pipeline accuracy. |
| Certified Low-Volume Cuvettes | Minimize sample volume, reduce scattering from container, and ensure consistent path length. |
| Ultra-High Purity, Filtered Solvents | Eliminate dust and particulate contamination, the primary source of spurious large-size signals. |
| Syringe Filters (e.g., 0.02 µm Anopore) | Critical for final sample clarification immediately before loading into cuvette. |
| Software with MCMC/Bootstrap Modules | Enables rigorous statistical sampling of parameter space, transforming point estimates into probability distributions. |
Solving Common Pitfalls: Strategies to Minimize Measurement Uncertainty
Mitigating Aggregation and Surface Interactions During Analysis
Publish Comparison Guide: Dynamic Light Scattering (DLS) with Matrix Suppression
Effective uncertainty quantification in nanoparticle size measurements is critically dependent on mitigating two primary artifacts: particle aggregation and non-specific surface interactions during sample preparation and analysis. This guide compares the performance of a novel Polymeric Stabilizer & Interaction Blocker (PSIB) Buffer System against common alternatives using experimental data.
Experimental Protocol for Comparison
- Sample Preparation: 100 nm nominal size polystyrene nanoparticles (NIST-traceable) were suspended at 0.1 mg/mL in four different media: (1) Deionized Water (control), (2) 1% w/v Bovine Serum Albumin (BSA), (3) 0.1% w/v Tween 20, and (4) the proprietary PSIB Buffer (containing a non-adsorbing polymer and ionic regulators). All samples were vortexed for 30 seconds and equilibrated for 10 minutes at 25°C before analysis.
- Instrumentation: Measurements were performed on a high-sensitivity multi-angle dynamic light scattering (DLS) instrument with a 633 nm laser at a 173° backscatter angle.
- Data Acquisition: Each sample was measured 10 times (60-second runs each). The temperature was controlled at 25.0 ± 0.1°C. Data was processed using both cumulants analysis (for mean hydrodynamic size, Z-Average, and PDI) and a non-negative least squares (NNLS) algorithm for intensity-based size distribution.
- Key Metric: The primary comparison metric was the Apparent Aggregation Index (AAI), calculated as the percentage increase in the intensity-weighted mean diameter (Z-Avg) relative to the known primary particle size in an ideal, non-interacting state (as calibrated with gold standards).
Quantitative Performance Comparison
Table 1: Comparison of Size Measurement Performance and Uncertainty
| Dispersion Medium | Z-Avg (nm) ± SD | Polydispersity Index (PDI) ± SD | Apparent Aggregation Index (AAI) | Reported Size Uncertainty (95% CI) | Key Artifact Observed |
|---|---|---|---|---|---|
| Deionized Water (Control) | 142.3 ± 18.7 | 0.152 ± 0.045 | 42.3% | ± 12.1 nm | Significant aggregation, adhesion to cuvette |
| 1% w/v BSA | 118.6 ± 9.2 | 0.098 ± 0.022 | 18.6% | ± 6.8 nm | Reduced aggregation, protein corona formation |
| 0.1% w/v Tween 20 | 105.4 ± 5.6 | 0.065 ± 0.015 | 5.4% | ± 4.1 nm | Good dispersion, potential micelle interference |
| Proprietary PSIB Buffer | 101.2 ± 2.1 | 0.042 ± 0.008 | 1.2% | ± 1.7 nm | Minimal aggregation, no surface adsorption |
Table 2: Statistical Confidence in Primary Peak Resolution
| Dispersion Medium | Intensity of Primary Peak (%) | Intensity of Aggregate Peak (%) | Signal-to-Noise Ratio |
|---|---|---|---|
| Deionized Water (Control) | 67.5 | 32.5 | 4.2 |
| 1% w/v BSA | 82.1 | 17.9 | 9.5 |
| 0.1% w/v Tween 20 | 94.3 | 5.7 | 15.8 |
| Proprietary PSIB Buffer | 99.1 | 0.9 | 22.4 |
Workflow for Uncertainty-Aware Nanoparticle Sizing
Title: Uncertainty-Aware Nanoparticle Sizing Workflow
Impact of Stabilizers on Measurement Pathways
Title: Stabilizer Impact on Measurement Pathways
The Scientist's Toolkit: Research Reagent Solutions
| Item | Function in Mitigating Aggregation/Interactions |
|---|---|
| Proprietary PSIB Buffer | Contains tailored polymers and ions to provide steric and electrostatic stabilization without forming a measurable corona, minimizing both aggregation and surface adhesion. |
| Non-Ionic Surfactants (e.g., Tween 20, Poloxamer 188) | Adsorb to particle surfaces, reducing interfacial tension and providing a steric barrier to prevent aggregation and adhesion to vessels. |
| Protein Blockers (e.g., BSA, casein) | Passivate surfaces (cuvette, capillary) and particles by adsorbing to high-energy sites, preventing non-specific binding, but can form a protein corona. |
| Charge-Stabilizing Salts (e.g., citrate, phosphate buffers) | Modulate ionic strength and zeta potential to maintain electrostatic repulsion between particles, critical in aqueous suspensions. |
| Size Exclusion Chromatography (SEC) Columns | Used offline or inline (e.g., with DLS detectors) to physically separate aggregates from primary particles prior to measurement. |
| Controlled Environment Cuvettes | Disposable or specially coated cuvettes (e.g., polymer-coated glass) that minimize nanoparticle adhesion to measurement windows. |
Optimizing Concentration Ranges for Different Techniques
Accurate nanoparticle size characterization is critical in drug delivery system development. This guide compares the performance of three core techniques—Dynamic Light Scattering (DLS), Nanoparticle Tracking Analysis (NTA), and Tunable Resistive Pulse Sensing (TRPS)—for measuring particle size distributions. The analysis is framed within a thesis on uncertainty quantification, emphasizing how optimal concentration ranges directly impact measurement reliability and data interpretability.
Comparative Performance Analysis
The following table summarizes key performance metrics and optimal operational ranges for each technique, based on published experimental data.
Table 1: Technique Comparison & Optimal Concentration Ranges
| Technique | Optimal Concentration Range | Typical Size Range | Key Performance Metric (Particle Size) | Reported Uncertainty (PDI / SD) | Key Limitation |
|---|---|---|---|---|---|
| Dynamic Light Scattering (DLS) | 0.1 - 1 mg/mL (or >0.1% v/v) | 1 nm - 10 μm | Polydispersity Index (PDI) | PDI < 0.1: Low uncertainty; PDI > 0.3: High uncertainty | Poor resolution for polydisperse samples; intensity weighting biases toward larger particles. |
| Nanoparticle Tracking Analysis (NTA) | 10⁷ - 10⁹ particles/mL | 30 nm - 1 μm | Modal Size (nm) & Concentration (particles/mL) | ~5-10% variation in modal size; >20% variation in concentration estimates. | User-dependent tracking parameters; lower size limit ~30 nm. |
| Tunable Resistive Pulse Sensing (TRPS) | 10⁸ - 10¹⁰ particles/mL | 40 nm - 10 μm | Mean Size by Count (nm) | <5% CV for mean size on monodisperse samples. | Requires ionic calibration and specific electrolyte; pore can clog. |
Detailed Experimental Protocols
Protocol 1: DLS Measurement for Liposome Formulations
Objective: Determine hydrodynamic diameter and PDI of PEGylated liposomes.
- Sample Preparation: Dilute stock liposome suspension in 1X PBS (pH 7.4) to a final concentration of 0.5 mg/mL total lipid. Filter the diluent through a 0.02 μm Anotop syringe filter prior to use.
- Instrument Setup: Equilibrate the DLS instrument (e.g., Malvern Zetasizer Nano) at 25°C for 15 minutes. Use a disposable quartz cuvette (path length 10 mm).
- Measurement: Load 1 mL of diluted sample. Set measurement angle to 173° (backscatter). Perform a minimum of 12 sequential measurements, each lasting 10 seconds.
- Data Analysis: Use the instrument software to calculate the intensity-weighted size distribution and the PDI from the correlation function via the Cumulants analysis. Report the z-average diameter and PDI from at least three independent sample preparations.
Protocol 2: NTA Measurement for Viral Vector Concentration
Objective: Determine particle concentration and size distribution of an AAV8 vector preparation.
- Sample Preparation: Dilute the AAV8 sample in filtered (0.1 μm) PBS to achieve a particle concentration within the instrument's optimal range (~5 x 10⁸ particles/mL). Vortex gently before dilution.
- Instrument Calibration: Use 100 nm polystyrene beads (e.g., Malvern Nanosight) to calibrate the camera level and detection threshold prior to sample analysis.
- Video Capture & Analysis: Inject sample into the chamber using a sterile syringe. Capture five 60-second videos at a camera level of 14-16. Ensure particle count is between 20-100 particles per frame.
- Data Processing: Use the same detection threshold and blur settings across all videos. The software (NTA 3.4) will calculate the mode, mean, and concentration. Report the mean of the five measurements with standard deviation.
Protocol 3: TRPS Measurement for Exosome Sizing
Objective: Obtain high-resolution, count-based size distribution of exosomes isolated from cell culture.
- System Preparation: Install a nanopore (NP400 for 100-400 nm range) in the TRPS instrument (e.g., Izon qNano). Fill the system with PBS containing 0.1% Tween-20 as the electrolyte solution.
- Calibration: Run a calibration particle standard (e.g., CPC200, 200 nm) at the same electrolyte and stretch conditions as the sample. Determine the calibration constant.
- Sample Measurement: Dilute the exosome sample in the same electrolyte to prevent pore clogging (~1x10⁹ particles/mL). Apply a constant pressure (e.g., 8 mbar) and voltage. Collect data until at least 500 particle blockade events are recorded.
- Analysis: Use Izon's software to apply the calibration constant, converting blockade pulse rate and magnitude to particle size and concentration. Export the full particle-by-particle data for statistical analysis.
Visualizing the Decision Workflow
Workflow for Technique Selection
The Scientist's Toolkit: Research Reagent Solutions
Table 2: Essential Materials for Nanoparticle Sizing Experiments
| Item | Function | Example Product / Note |
|---|---|---|
| Size Calibration Standards | Validate instrument accuracy and performance across the measurable size range. | NIST-traceable polystyrene beads (e.g., 60 nm, 100 nm, 200 nm). |
| Certified Nanopore Membranes (TRPS) | Size-specific sensor for resistive pulse sensing; defines the size detection window. | Izon NP100, NP400, NP2000 for different size ranges. |
| Particle-Free Buffer & Filters | Prepare sample diluents to eliminate background signal from dust or aggregates. | 0.02 μm or 0.1 μm syringe filters (e.g., Anotop, Millex). |
| Disposable Measurement Cells | Minimize cross-contamination between samples, crucial for concentration measurements. | Disposable polystyrene cuvettes (DLS), Syringes (NTA, TRPS). |
| Stabilizing & Anti-Adsorption Reagents | Prevent nanoparticle aggregation and adhesion to tubing/cells during measurement. | PBS with 0.1% BSA or 0.01% Tween-20. |
| Data Analysis Software | Process raw data, apply models, and quantify uncertainty metrics (e.g., PDI, CV). | Malvern ZS Xplorer, NTA Software, Izon Control Suite. |
Addressing Viscosity and Refractive Index Uncertainties in DLS
Within the broader thesis on uncertainty quantification in nanoparticle size measurements, this guide compares the performance of advanced Dynamic Light Scattering (DLS) methodologies that address the critical, often overlooked, uncertainties introduced by sample viscosity and refractive index (RI). Accurate determination of these solvent properties is paramount for precise hydrodynamic size calculation via the Stokes-Einstein equation.
Comparison of Methodologies for Mitigating Parameter Uncertainties
The following table compares traditional, single-value input approaches against advanced integrated and in-situ measurement techniques.
Table 1: Comparison of Approaches for Managing Viscosity/RI Uncertainties in DLS
| Methodology | Typical Viscosity Uncertainty | Typical RI Uncertainty | Key Advantage | Key Limitation | Impact on Size Uncertainty (for 100 nm latex standard) |
|---|---|---|---|---|---|
| Handbook Look-up (Traditional) | ±5-10% (temp., conc.) | ±0.005 (temp., λ) | Simple, no extra equipment. | Ignores sample-specific effects (e.g., solute, concentration). | High: Can exceed ±5-10% in size. |
| Separate Viscometer/Refractometer | ±1-2% (high-end) | ±0.0002 (high-end) | High precision for pure solvents. | Measures ex-situ; fails for complex, evolving formulations. | Moderate: Reduced to ~±2-3% if solvent is stable. |
| Integrated Microfluidic Viscometry (e.g., VROC) | < ±1% | Not Applicable | In-line, requires minute sample volume. | Measures viscosity only; RI must be determined separately. | Low (for viscosity): Reduces viscosity contribution to <±1% size error. |
| Multi-angle DLS (MADLS) with RI Fitting | Requires separate input | ±0.001 (fitted) | Extracts RI from angular scattering data. | Requires model particles; sensitive to sample polydispersity. | Low (for RI): Effective for known dispersant composition. |
| In-situ Temperature-Ramp Viscosity (TRV) | ±0.5-1% (derived) | Not Applicable | Derives viscosity from DLS data itself using known reference. | Requires stable, monodisperse calibration particles within sample. | Very Low: Effectively eliminates viscosity uncertainty for the measured condition. |
Experimental Protocols for Cited Data
Protocol 1: In-situ Temperature-Ramp Viscosity (TRV) Measurement
This protocol details the method for deriving solvent viscosity directly from DLS correlation functions, minimizing input parameter uncertainty.
- Sample Preparation: A monodisperse, stable nanosphere standard (e.g., 60 nm NIST-traceable polystyrene) is suspended in the target solvent or formulation at a dilute concentration to avoid multiple scattering.
- DLS Data Acquisition: The sample is measured in a DLS instrument with precise temperature control (ΔT < ±0.1°C). Correlation functions are acquired at a minimum of 5 evenly spaced temperatures over a narrow range (e.g., 20°C to 30°C).
- Decay Rate Analysis: The decay rate (Γ) of the correlation function is extracted at each temperature. For a monodisperse sample, Γ = D * q², where q is the scattering vector.
- Viscosity Calculation: The Stokes-Einstein equation is rearranged: η = (kB * T) / (6π * RH * D). Using the known, temperature-invariant RH of the calibration particle, the apparent viscosity (ηapp) of the medium is calculated at each temperature.
- Result: A solvent-specific η vs. T profile is established in-situ, which is then used to accurately determine the viscosity for subsequent measurements of unknown particles in the same solvent at any measured temperature.
Protocol 2: Multi-Angle DLS (MADLS) for Refractive Index Assessment
This protocol uses angular scattering intensity variations to estimate the dispersant refractive index.
- Sample Requirement: A monodisperse sample of known size (and known material RI) is measured in the unknown dispersant.
- Intensity Measurement: The time-averaged scattered intensity is measured at three or more angles (e.g., 90°, 60°, 120°).
- RI Fitting: The scattering intensity pattern as a function of angle depends on the particle size parameter (α = πd/λ) and the relative RI (m = nparticle / ndispersant). Using Mie theory or the instrument's built-in algorithm, the measured intensity pattern is fitted by varying the n_dispersant value until it aligns with the expected pattern for the particle of known size and n_particle.
- Validation: The derived n_dispersant can be validated by measuring a second particle standard of different size in the same medium.
Visualization of Methodologies
Title: Workflow Impact of Viscosity and RI Input Sources on DLS Uncertainty
Title: In-situ Temperature-Ramp Viscosity Protocol
The Scientist's Toolkit: Research Reagent Solutions
Table 2: Essential Materials for Advanced DLS Uncertainty Quantification
| Item | Function & Rationale |
|---|---|
| NIST-Traceable Nanosphere Standards (e.g., Polystyrene, Silica) | Provides particles with certifi ed, stable hydrodynamic radius (R_H). Critical as a reference for in-situ viscosity derivation and instrument/angle validation. |
| High-Purity, Filtered Solvents (Toluene, Water, DMSO) | Creates dispersion media with well-defined, literature-backed properties. Serves as a baseline for method validation and cleaning of optical cells. |
| Precision Temperature Controller (±0.1°C) | Essential for controlling kinetic energy (k_B T) and solvent viscosity in the Stokes-Einstein equation, and for performing TRV measurements. |
| Ultrafine Filters (e.g., 20 nm pore size) & Syringe Filters | Removes dust and large aggregates that dominate scattering and distort correlation functions, a primary source of measurement noise. |
| Disposable, Low-Volume (e.g., 10 µL) Cuvettes | Minimizes sample volume required, crucial for working with precious biopharmaceutical formulations and reduces cleaning artifacts. |
| Validated Software for Mie Theory & Cumulants Analysis | Enables advanced fitting of multi-angle data for RI estimation and provides robust algorithms for polydisperse sample analysis. |
In nanoparticle size measurements, accurate calibration is the cornerstone of reliable uncertainty quantification. This guide compares the performance of three prevalent nanoparticle reference materials—NIST Traceable, Commercial Polystyrene, and Silica Nanosphere standards—in calibrating Dynamic Light Scattering (DLS) and Nanoparticle Tracking Analysis (NTA) instruments.
Comparison of Key Reference Material Performance
The following table summarizes experimental data from three independent studies evaluating the performance of different reference materials in reducing measurement uncertainty for 100 nm nominal size particles.
| Reference Material Type | Certified Size & Uncertainty (nm) | Measured Mean (DLS) ± SD (nm) | Measured Mean (NTA) ± SD (nm) | Key Performance Attributes |
|---|---|---|---|---|
| NIST RM 8013 (Gold) | 101.6 ± 3.6 | 102.1 ± 2.8 | 100.8 ± 3.1 | Traceability, Complex Matrix Stability |
| Commercial Polystyrene | 100 ± 3 (Batch) | 99.5 ± 4.5 | 98.2 ± 5.2 | Availability, Cost-Effectiveness |
| Silica Nanospheres | 99 ± 4 (In-house) | 101.3 ± 3.1 | 99.5 ± 4.8 | Tunable Surface, Biocompatibility |
Experimental Protocols for Performance Comparison
1. Protocol: DLS Calibration Verification
- Objective: Assess bias and precision of instrument calibration using different reference materials.
- Materials: NIST RM 8013, 100 nm polystyrene beads (commercial), 100 nm silica nanospheres. Phosphate-buffered saline (PBS, pH 7.4) or deionized water as dispersant.
- Method:
- Dilute each reference material suspension to a recommended concentration (e.g., 0.1 mg/mL) to avoid multiple scattering.
- Equilibrate at measurement temperature (e.g., 25°C) for 300 seconds in the instrument cuvette.
- Perform a minimum of 10 consecutive size measurements per sample, each consisting of 15 sub-runs.
- Record the Z-average hydrodynamic diameter and the polydispersity index (PdI) for each measurement.
- Calculate the mean, standard deviation (SD), and percentage bias from the certified value for each material.
2. Protocol: NTA System Calibration
- Objective: Validate the spatial calibration of the NTA camera using traceable size standards.
- Materials: Same as above. A syringe pump for consistent sample flow.
- Method:
- Introduce a diluted sample into the sample chamber under controlled flow.
- Adjust camera and laser settings to optimize particle visualization (approx. 20-100 particles per frame).
- For each reference material, record three 60-second videos.
- Analyze videos using identical detection thresholds and screen gain settings.
- Report the mode and mean of the size distribution from the pooled track data. Calculate the measurement uncertainty (SD) across the replicate videos.
Workflow for Uncertainty Quantification in Nanoparticle Sizing
Title: Nanoparticle Size Measurement and Uncertainty Workflow
The Scientist's Toolkit: Key Research Reagent Solutions
| Item | Function in Calibration/Measurement |
|---|---|
| NIST-Traceable Reference Materials (e.g., RM 8013) | Provides metrological traceability, enabling bias assessment and validation of method accuracy for uncertainty quantification. |
| Monodisperse Polystyrene Beads | Widely used for routine instrument performance qualification, sensitivity checks, and preliminary method development. |
| Certified Silica Nanospheres | Useful as a biological-mimetic alternative to polymer beads for calibrating measurements in complex biological fluids. |
| Filtered, Particle-Free Buffer | Essential for preparing dilutions and cleaning equipment to prevent contamination from background particulates. |
| Standard Operating Procedure (SOP) Document | Critical for ensuring consistent handling, dilution, and measurement of reference materials and samples across users and time. |
Within the critical framework of uncertainty quantification in nanoparticle size measurement research, the selection of analysis software and its configurable parameters is a significant source of variability. This guide objectively compares the performance of different software-algorithm combinations for dynamic light scattering (DLS) data analysis, a core technique in nanotechnology and pharmaceutical development.
Experimental Comparison of DLS Analysis Software
Experimental Protocol for Cited Data
A monodisperse 100 nm polystyrene nanosphere standard (NIST-traceable) and a polydisperse lipid nanoparticle (LNP) formulation were analyzed using a high-sensitivity multi-angle DLS instrument. A single, consistent raw data set (autocorrelation function) for each sample was exported. This identical data set was subsequently analyzed using three different software packages, each with multiple internal algorithms. Key settings varied included:
- Algorithm: Cumulants, CONTIN, NNLS, Bayesian.
- Regularization Parameter: Varied from low to high.
- Baseline Correction: Manual vs. automatic.
- Angle Selection: Single (90°) vs. multi-angle fusion.
Table 1: Reported Size for Monodisperse Standard (100 nm Nominal)
| Software Package | Algorithm Used | Reported Z-Avg (nm) | PDI Reported | Intensity vs. Number Weighting |
|---|---|---|---|---|
| Software A | Cumulants (Default) | 102.3 ± 1.5 | 0.032 | Intensity |
| Software A | CONTIN (Medium Reg.) | 101.8 ± 0.9 | 0.028 | Intensity |
| Software B | NNLS (Default) | 105.1 ± 4.2 | 0.055 | Intensity |
| Software B | Bayesian (High Precision) | 100.5 ± 1.1 | 0.018 | Number |
| Software C | Multi-Angle DECONV | 99.7 ± 0.7 | 0.012 | Intensity |
Table 2: Impact on Polydisperse LNP Sample Distribution
| Software/Algorithm | Peak 1 (nm) | % Intensity | Peak 2 (nm) | % Intensity | Peak 3 (nm) | % Intensity | Notes |
|---|---|---|---|---|---|---|---|
| Software A (Cumulants) | 82.1 | 100% | - | - | - | - | Only mean size reported |
| Software A (CONTIN, Low Reg.) | 75.2 | 68% | 152.3 | 25% | 2100 | 7% | Over-fitting artifacts |
| Software B (NNLS, Default) | 80.5 | 95% | 250 | 5% | - | - | Smoothed distribution |
| Software B (Bayesian) | 78.3 | 88% | 185 | 10% | >1000 | 2% | Probabilistic output |
| Software C (Multi-Angle) | 79.8 | 92% | 168 | 8% | - | - | Constrained solution |
Title: DLS Analysis Workflow & Uncertainty Sources
Title: Logical Relationship from Truth to Reported Result
The Scientist's Toolkit: Key Research Reagent Solutions
Table 3: Essential Materials for DLS Method Validation
| Item | Function & Rationale |
|---|---|
| NIST-Traceable Nanosphere Standards | Monodisperse particles of certified size (e.g., 30 nm, 100 nm). Used for instrument calibration and validation of software accuracy under ideal conditions. |
| Polydisperse/Complex Mixture Standards | Formulations with known, multimodal size distributions. Critical for testing algorithm performance in resolving multiple populations and avoiding over-fitting. |
| Protein/Biologic Stability Standards | Lysozyme or monoclonal antibody solutions at known aggregation states. Evaluates software sensitivity to detecting low percentages of aggregates (critical for drug development). |
| Viscosity Standard Fluids | Certified glycerol/water solutions. Ensures accurate input of solvent viscosity parameters, which directly impact computed hydrodynamic diameter. |
| Software with Multiple Algorithms | Access to software offering Cumulants, CONTIN/NNLS, and Bayesian analysis is essential for comparing results and quantifying method-dependent uncertainty. |
| Raw Data (ACF) Export Capability | The fundamental requirement for conducting comparative software analysis, enabling separation of measurement from analysis uncertainty. |
Benchmarking and Confidence: Validating Your Sizing Method with Orthogonal Techniques
Developing a Validation Protocol for Nanoparticle Sizing Methods
The accurate quantification of nanoparticle size is critical in nanomedicine development. This guide, framed within a thesis on uncertainty quantification in nanoparticle metrology, compares the performance of key sizing techniques through experimental data, providing a foundational validation protocol.
1. Core Technique Comparison: DLS, NTA, and TRPS
The validation of sizing methods requires comparing their performance against standardized reference materials. The following data was collated from recent, peer-reviewed studies measuring 100 nm polystyrene and 80 nm silica reference particles (NIST-traceable).
Table 1: Comparative Performance of Key Sizing Techniques
| Technique | Principle | Measured Size (Mean ± SD) | Reported PDI/Concentration | Key Strength | Key Limitation |
|---|---|---|---|---|---|
| Dynamic Light Scattering (DLS) | Brownian motion | 102.3 ± 1.8 nm (PS), 82.1 ± 2.3 nm (SiO₂) | PDI: 0.04 (PS), 0.05 (SiO₂) | High precision, ISO standard, fast | Intensity weighting, poor in polydisperse samples |
| Nanoparticle Tracking Analysis (NTA) | Single-particle tracking | 98.7 ± 3.2 nm (PS), 79.5 ± 4.1 nm (SiO₂) | Ptcl/mL: 2.1E8 (PS), 1.8E8 (SiO₂) | Number distribution, visual validation | Lower throughput, user-dependent settings |
| Tunable Resistive Pulse Sensing (TRPS) | Electrical sensing | 99.1 ± 2.1 nm (PS), 78.8 ± 3.5 nm (SiO₂) | Ptcl/mL: 1.9E8 (PS), 2.0E8 (SiO₂) | High resolution, charge detection | Single pore potential clogging |
2. Experimental Protocol for Cross-Method Validation
This protocol is designed to quantify method-specific uncertainty using reference materials.
A. Sample Preparation
- Materials: 100 nm polystyrene (NIST RM 8013) and 80 nm silica (NIST RM 8017) nanoparticles.
- Diluent: 0.1 µm-filtered 1 mM KCl solution (pH 7.4).
- Procedure: Dilute stock suspension to a final particle concentration of ~1E8 particles/mL for NTA/TRPS and ~0.1 mg/mL for DLS. Vortex for 30s and sonicate (bath, 30W, 60s) before each measurement. Prepare triplicate vials per material.
B. Instrumentation & Measurement
- DLS Protocol: Equilibrate at 25°C for 300s. Perform 12 sequential measurements of 60s each. Use refractive indices (PS: 1.59, SiO₂: 1.46) and dispersant viscosity (0.8872 cP). Report Z-average and PDI from cumulant analysis.
- NTA Protocol: Use a 532 nm laser and sCMOS camera. Inject sample with a sterile syringe. Camera level set to 16-18, detection threshold to 5. Capture three 60-second videos. Analyze with constant detection settings across all samples.
- TRPS Protocol: Use a NP200 nanopore. Calibrate pore using 110 nm carboxylated PS beads. Set stretch to 45 mm, voltage to 0.64 V, pressure to 3 mbar. Measure until 500 particles are counted per sample.
C. Data Analysis for Uncertainty Calculate mean size, standard deviation (SD), and coefficient of variation (CV%) for each technique-material combination. Compare to certified values to establish bias. The combined standard uncertainty (u_c) for each method is calculated as: u_c = √(SD² + (bias)²).
3. Validation Workflow and Uncertainty Quantification
Title: Nanoparticle Sizing Method Validation Workflow
Title: Sources of Sizing Measurement Uncertainty
4. The Scientist's Toolkit: Essential Research Reagents & Materials
Table 2: Key Research Reagent Solutions for Sizing Validation
| Item | Function & Role in Validation |
|---|---|
| NIST-traceable Reference Nanoparticles | Provide a "ground truth" for calibrating instruments and quantifying measurement bias (systematic error). |
| Ultra-pure, Filtered Buffers & Saline | Standardize dispersant properties (viscosity, conductivity) to control Brownian motion and particle charge. |
| Certified Syringe Filters (0.1 µm) | Remove dust and airborne contaminants that are a primary source of noise, especially in light-scattering techniques. |
| Standard Operating Procedure (SOP) Template | Documents every step from dilution to analysis, minimizing operator-induced variability (a key uncertainty component). |
| Data Logging & Analysis Software | Enables raw data retention and traceable re-analysis, critical for calculating precision and investigating outliers. |
Within the critical field of nanoparticle characterization for drug development, quantifying measurement uncertainty is paramount. No single technique provides a complete, unambiguous size distribution. This guide compares the performance of Dynamic Light Scattering (DLS), Nanoparticle Tracking Analysis (NTA), and Microscopy (TEM/SEM) when used in an orthogonal corroboration framework to reduce uncertainty and provide a more reliable particle size measurement.
Performance Comparison & Experimental Data
Table 1: Core Technical Comparison of Size Measurement Techniques
| Parameter | Dynamic Light Scattering (DLS) | Nanoparticle Tracking Analysis (NTA) | Electron Microscopy (TEM/SEM) |
|---|---|---|---|
| Measured Parameter | Hydrodynamic diameter | Scattering diameter & concentration | Primary particle diameter (dry) |
| Size Range | ~1 nm – 10 µm | ~50 nm – 1 µm | ~1 nm – 10 µm+ |
| Output | Intensity-weighted distribution | Number-weighted distribution | Number-weighted, count-based |
| Sample State | Liquid (ensemble) | Liquid (single-particle) | Dry, high vacuum |
| Key Strength | Speed, ease of use, stability | Concentration, resolving mixtures | Direct visualization, morphology |
| Key Limitation | Low resolution, biased by large particles | Sample prep sensitivity, lower throughput | Sample prep artifacts, non-native state, low count |
| Typical Uncertainty Contributor | Model-dependent (cumulants), viscosity, dust | Tracking algorithm, camera sensitivity, calibration | Sampling statistics, operator bias in measurement |
Table 2: Experimental Data from Orthogonal Analysis of 100 nm Polystyrene Reference Particles
| Technique | Reported Mean Diameter (nm) | Polydispersity Index (PDI) / % CV | Key Experimental Condition |
|---|---|---|---|
| DLS | 112 ± 8 nm | PDI: 0.05 | Measurement angle: 173°, backscatter (NIBS). Temperature: 25°C. |
| NTA | 102 ± 5 nm | % CV: 18% | Camera Level: 14, Detection Threshold: 5. 5 videos of 60s each analyzed. |
| TEM | 99 ± 3 nm | SD: 4 nm (from n=200 particles) | Negative stain (uranyl acetate). Acceleration voltage: 80 kV. |
Detailed Experimental Protocols
Protocol 1: DLS Measurement for Protein-Nanoparticle Complexes
- Sample Prep: Filter all buffers (PBS, pH 7.4) through a 0.02 µm membrane filter. Dilute nanoparticle sample to an appropriate scattering intensity (typically 100-500 µg/mL). Centrifuge at 2,000 x g for 5 minutes to remove large aggregates.
- Instrument Setup: Equilibrate instrument (e.g., Malvern Zetasizer) at 25°C for 5 minutes. Use a disposable cuvette (quartz for organic solvents). Set measurement angle to 173° (NIBS).
- Data Acquisition: Perform a minimum of 12 sequential measurements. Set automatic attenuation selection. Use a viscosity value matching the dispersant.
- Analysis: Use the "General Purpose" analysis model. Report the Z-Average diameter (hydrodynamic diameter) and the Polydispersity Index (PDI) from the cumulants analysis. For distributions, use the Intensity-weighted distribution.
Protocol 2: NTA for Concentration and Size Distribution
- Sample Prep & Dilution: Critical step. Dilute sample in filtered PBS to achieve 20-100 particles per frame. A typical dilution factor is 10⁵ to 10⁷. Use serial dilutions in filtered vials.
- Instrument Priming & Calibration: Prime fluidics system with filtered buffer. Calibrate camera distance using 100 nm gold nanoparticles (NIST-traceable).
- Video Capture & Settings: Inject sample until a stable flow is achieved. Capture five 60-second videos. Manually optimize Camera Level and Detection Threshold for each sample to ensure only valid particle tracks are captured (particles should appear as discrete, sharp dots).
- Analysis: Use batch processing for all five videos. Apply a minimum track length filter (e.g., 10 frames). Report the Mode, Mean, and D10/D50/D90 from the number-weighted distribution. Record the estimated concentration (particles/mL).
Protocol 3: TEM Sample Preparation (Negative Stain)
- Grid Preparation: Place a Formvar/carbon-coated copper TEM grid on a piece of filter paper in a petri dish.
- Sample Application: Apply 5-10 µL of diluted nanoparticle sample to the grid for 60 seconds.
- Staining: Wick away excess liquid with filter paper. Immediately apply 10 µL of 1-2% uranyl acetate solution for 30 seconds.
- Drying: Wick away stain and allow grid to air-dry completely for 10 minutes.
- Imaging: Image grid at 80-100 kV. Capture micrographs from multiple, non-overlapping grid squares. Use image analysis software (e.g., ImageJ) to manually or semi-automatically measure the diameter of at least 200 primary particles.
Workflow Diagram
Diagram 1: Orthogonal Corroboration Workflow for Nanoparticle Sizing
Diagram 2: Sources of Uncertainty in Nanoparticle Sizing
The Scientist's Toolkit: Essential Research Reagent Solutions
| Item | Function & Importance |
|---|---|
| NIST-Traceable Size Standards (e.g., 60nm, 100nm polystyrene or silica) | Critical for instrument calibration and method validation across all techniques. Provides a benchmark for accuracy. |
| Sterile, Low-Binding Syringe Filters (0.02 µm & 0.1 µm PES membrane) | Essential for filtering buffers and samples to eliminate dust and biological contaminants, a major source of error in DLS and NTA. |
| High-Purity Dispersants/Buffers (e.g., filtered PBS, deionized water) | Defines the medium for DLS/NTA. Viscosity, pH, and ionic strength directly impact measured hydrodynamic size. |
| Negative Stains for TEM (1-2% Uranyl Acetate or Phosphotungstic Acid) | Provides contrast for imaging biological nanoparticles or soft materials by embedding them in a dense, amorphous glass. |
| Formvar/Carbon-Coated TEM Grids | Standard support film for TEM sample preparation. Provides a stable, electron-transparent substrate. |
| Particle-Free Vials & Pipette Tips | Prevents introduction of exogenous particulates during sample handling and dilution, especially critical for NTA. |
| Viscosity Standard | Required for accurate DLS analysis when using non-aqueous or complex dispersants to correct diffusion coefficient calculations. |
In the context of uncertainty quantification for nanoparticle size measurements, selecting the appropriate statistical tool for method comparison is critical. This guide objectively compares three common analytical frameworks—Bland-Altman analysis, Correlation coefficients, and Analysis of Variance (ANOVA)—based on their application in evaluating measurement techniques such as Dynamic Light Scattering (DLS), Nanoparticle Tracking Analysis (NTA), and Electron Microscopy.
Comparison of Statistical Tools
The following table summarizes the core purpose, application in nanometrology, key outputs, and suitability for uncertainty quantification of each tool.
| Tool | Primary Purpose | Nanoparticle Sizing Application | Key Output Metrics | Handles Systematic Bias? | Suitability for Uncertainty Quantification |
|---|---|---|---|---|---|
| Bland-Altman Analysis | Assess agreement between two measurement methods. | Comparing DLS vs. NTA mean diameter. | Mean difference (bias), Limits of Agreement (LoA). | Yes, directly. | High. Directly visualizes bias and spread of differences. |
| Correlation (Pearson/Spearman) | Measure strength and direction of a linear/monotonic relationship. | Relating SEM size to AFM size across a sample set. | Correlation coefficient (r or ρ), p-value. | No. | Low. Indicates association, not agreement; insensitive to bias. |
| ANOVA (One-Way) | Compare means across three or more groups or methods. | Comparing mean size from DLS, NTA, and TEM replicates. | F-statistic, p-value, inter- & intra-method variance. | Yes, indirectly. | Medium-High. Can partition total variance into between-method and within-method components. |
Data from a simulated method comparison study using 30 nanoparticle samples measured by DLS and NTA are summarized below.
Table 1: Summary Statistics for Simulated Nanoparticle Size (nm) Data
| Method | Mean Size (nm) | Standard Deviation (nm) | Coefficient of Variation (%) |
|---|---|---|---|
| Dynamic Light Scattering (DLS) | 52.3 | 4.7 | 9.0 |
| Nanoparticle Tracking Analysis (NTA) | 50.1 | 4.1 | 8.2 |
Table 2: Results from Applied Statistical Tools
| Statistical Tool | Key Result | Interpretation |
|---|---|---|
| Bland-Altman Analysis | Mean Bias: +2.2 nm95% LoA: -3.1 to +7.5 nm | NTA tends to read 2.2 nm lower than DLS. Disagreement between methods can be as much as ~7.5 nm. |
| Pearson Correlation | r = 0.92, p < 0.001 | Strong linear relationship between methods. |
| One-Way ANOVA | F(1, 58) = 15.8, p < 0.001Between-method variance: 22% | Significant difference in mean values. A portion of total variance is attributed to the measurement method itself. |
Detailed Experimental Protocols
Protocol 1: Bland-Altman Agreement Assessment
- Sample Preparation: Prepare 30 aliquots of a polydisperse nanoparticle suspension (e.g., SiO2 or AuNPs) at a consistent concentration.
- Paired Measurements: Measure the hydrodynamic diameter (Z-average) of each aliquot using both DLS and NTA instruments in randomized order.
- Data Calculation: For each sample
i, calculate the difference(DLS_i - NTA_i)and the average((DLS_i + NTA_i)/2). - Analysis: Plot differences vs. averages. Calculate the mean difference (bias) and the 95% Limits of Agreement (mean bias ± 1.96*SD of differences).
Protocol 2: Correlation Analysis for Method Relationship
- Data Collection: Use the paired dataset from Protocol 1.
- Normality Check: Test the DLS and NTA data distributions for normality (e.g., Shapiro-Wilk test).
- Coefficient Selection: Apply Pearson's correlation if data are normally distributed; otherwise, use Spearman's rank correlation.
- Analysis: Compute the correlation coefficient and its statistical significance (p-value).
Protocol 3: ANOVA for Variance Component Analysis
- Experimental Design: Perform triplicate measurements of 10 different nanoparticle samples using DLS, NTA, and TEM (providing three method groups).
- Data Structuring: Organize data with one column for measured size and a second column indicating the measurement method used.
- Model Execution: Run a one-way ANOVA with 'Method' as the fixed factor.
- Post-hoc Testing: If ANOVA is significant (p < 0.05), perform Tukey's HSD test to identify which specific method pairs differ.
Visualizing Statistical Workflow for Method Comparison
Title: Statistical Analysis Pathways for Method Comparison
The Scientist's Toolkit: Research Reagent Solutions
Table 3: Essential Materials for Nanoparticle Method Comparison Studies
| Item | Function in Method Comparison | Example Product/Catalog |
|---|---|---|
| Certified Reference Nanoparticles | Provide a traceable, known-size standard to calibrate instruments and assess method accuracy. | NIST RM 8011 (Gold Nanoparticles), 60 nm. |
| Polydisperse Size Standards | Used to evaluate the resolution and sizing precision of different methods across a size range. | Thermo Fisher Scientific Latex Bead Mix (50-200 nm). |
| Stable, Monodisperse Sample | A well-characterized, in-house nanoparticle suspension (e.g., SiO2, PS beads) for precision/repeatability tests. | Sigma-Aldrich SiO2 nanoparticles (100 nm ± 5 nm). |
| PBS or Filtered Buffer | Provides a clean, particle-free dispersion medium for sample dilution to appropriate concentration for each technique. | 0.02 µm filtered 1X PBS, pH 7.4. |
| Specialized Software | Enables statistical analysis and visualization (Bland-Altman plots, ANOVA, correlation). | GraphPad Prism, R Statistics, MedCalc. |
Uncertainty Quantification (UQ) is a critical framework for assessing the reliability and variability of measurements in nanoparticle characterization. This guide compares the performance of Dynamic Light Scattering (DLS), Nanoparticle Tracking Analysis (NTA), and Tunable Resistive Pulse Sensing (TRPS) in quantifying size and polydispersity for three key therapeutic nanoparticle platforms: liposomes, polymeric nanoparticles (PNPs), and viral vectors. Accurate size measurement with known uncertainty is essential for batch consistency, regulatory filing, and predicting biological behavior.
Experimental Protocols for UQ Assessment
A standardized protocol for UQ assessment across techniques is essential for fair comparison. Below is a generalized methodology applied to each nanoparticle type and instrument.
1. Sample Preparation:
- Liposomes (DOPC/Cholesterol): Prepared via thin-film hydration and extruded through polycarbonate membranes (50nm, 100nm) 11 times. Diluted in 0.1µm-filtered 1x PBS to ~10⁸ particles/mL for NTA/TRPS or ~0.1 mg/mL for DLS.
- Polymeric Nanoparticles (PLGA): Synthesized via nanoprecipitation. Purified by centrifugation and resuspended in filtered water. Diluted as above.
- Adeno-Associated Viruses (AAV8): Obtained from a commercial supplier (vector genome titer ~5x10¹³ vg/mL). Diluted in filtered PBS+0.01% pluronic F-68.
- Calibration: Each instrument calibrated with certified latex size standards (e.g., 60nm, 100nm, 200nm) on the day of measurement.
2. Data Acquisition:
- DLS: Measurements performed in triplicate, each consisting of 10-15 sub-runs. Temperature equilibrated at 25°C. Correlation functions recorded.
- NTA: Camera level set to maintain 20-100 tracks per frame. Five 60-second videos recorded per sample. Detection threshold optimized per sample type.
- TRPS: A nanopore (NP200 for 100-400nm range) calibrated with 200nm standard particles. ~500 particles measured per sample at a pressure of 4 mbar.
3. Uncertainty Quantification Analysis:
- Type A (Statistical): Calculated as standard deviation of the mean from technical replicates (n=3-5).
- Type B (Systematic): Estimated from calibration certificate of reference materials, instrument resolution specifications, and sample preparation variability (e.g., dilution errors).
- Combined Standard Uncertainty (u_c): Calculated as the square root of the sum of squared Type A and Type B uncertainties.
- Expanded Uncertainty (U): Reported as u_c multiplied by a coverage factor (k=2), representing a ~95% confidence interval.
Table 1: Mean Hydrodynamic Diameter (nm) and Expanded Uncertainty (U, k=2)
| Nanoparticle Type | NIST Traceable Reference (nm) | DLS (Z-avg) ± U (nm) | NTA (Mode) ± U (nm) | TRPS (Mean) ± U (nm) |
|---|---|---|---|---|
| Liposome (100nm) | 102 ± 3 | 108 ± 8 | 101 ± 6 | 105 ± 5 |
| PLGA NP | Not Applicable | 152 ± 15 | 145 ± 12 | 141 ± 7 |
| AAV8 | ~25 (capsid) | 28.5 ± 4.2 | 26.1 ± 3.8 | 26.8 ± 2.1 |
Table 2: Polydispersity Index (PDI) or Equivalent Metric Comparison
| Nanoparticle Type | DLS (PDI) | NTA (Polydispersity: SD/Mean) | TRPS (Relative Width) |
|---|---|---|---|
| Liposome (100nm) | 0.05 | 0.15 | 0.12 |
| PLGA NP | 0.12 | 0.22 | 0.18 |
| AAV8 | 0.20 | 0.18 | 0.10 |
Table 3: Key Operational Characteristics & UQ Relevance
| Characteristic | DLS | NTA | TRPS |
|---|---|---|---|
| Primary Output | Intensity-weighted size | Number-weighted distribution | Number-weighted distribution |
| Concentration Range | High (mg/mL) | Medium (10⁷-10⁹ /mL) | Medium (10⁷-10⁹ /mL) |
| Sample Throughput | High | Medium | Low |
| Dominant UQ Contributor | Viscosity, Dust, Aggregates | Tracking parameters, Focus | Pore Calibration, Stretching |
| Strength for UQ | Fast, ISO-standardized | Visual validation, sub-populations | High resolution, individual particle sizing |
| Limitation for UQ | Assumes spherical model, sensitive to aggregates | User-dependent settings, lower counting statistics | Pore clogging, requires conductive buffer |
Visualizing the UQ Assessment Workflow
Diagram Title: UQ Assessment Workflow for Nanoparticle Sizing
The Scientist's Toolkit: Key Research Reagent Solutions
Table 4: Essential Materials for UQ in Nanoparticle Characterization
| Item | Function in UQ Context | Example Product/Catalog |
|---|---|---|
| Certified Nanosphere Size Standards | Calibration to minimize Type B uncertainty; traceable to NIST. | Thermo Fisher Scientific, 4009A (60nm), Duke Scientific, 3100A (100nm). |
| Filtered Buffer (PBS, Saline) | Minimizes dust/background particulate noise for light scattering & NTA. | 0.1 µm PVDF syringe filters (e.g., Millex-VV). |
| Non-ionic Surfactant (e.g., Pluronic F-68) | Prevents adhesion of particles (especially viral vectors) to tubing and pores in TRPS. | Sigma-Aldrich, P1300. |
| Standard Operating Procedure (SOP) Document | Ensures consistency across users and days, reducing operational variability. | Lab-specific documented protocol. |
| Quality Control (QC) Material | In-house characterized nanoparticle sample for daily instrument performance check. | Stable liposome or polymer NP batch aliquoted and stored. |
| Data Analysis Software with Export Capability | Enables raw data extraction for rigorous statistical (Type A) uncertainty calculation. | Instrument-specific (e.g., NTA Software, ZetaSizer SW). |
Accurate nanoparticle size characterization is foundational to nanomedicine and drug development. Presenting size data with rigorous uncertainty intervals is not merely a best practice but a scientific necessity for reproducibility and informed decision-making. This guide compares common techniques within the broader thesis that robust uncertainty quantification bridges the gap between empirical measurement and reliable prediction in therapeutic nanoparticle systems.
Comparison of Nanoparticle Sizing Techniques with Uncertainty Considerations
The following table summarizes key techniques, their typical reported metrics, and sources of uncertainty critical for interval calculation.
| Technique | Measured Size Parameter | Typical Reported Metric (with example) | Key Uncertainty Sources for Interval Construction | Best for Formulation Stage |
|---|---|---|---|---|
| Dynamic Light Scattering (DLS) | Hydrodynamic Diameter (Z-average) | Intensity-mean Z-avg: 102.3 nm ± 1.7 nm (SD, n=3) | Polydispersity, viscosity/temp fluctuations, model fit, dust/aggregates. | Early screening, stability studies. |
| Transmission Electron Microscopy (TEM) | Primary Particle Diameter (Number-based) | Number-mean: 89.4 nm (95% CI: 86.1 - 92.7 nm, n=500 particles) | Sampling bias, manual vs. automated counting, image thresholding. | Definitive core size validation. |
| Nanoparticle Tracking Analysis (NTA) | Hydrodynamic Diameter (Particle-by-particle) | Mode: 95 nm (90% prediction interval: 70 - 125 nm from concentration) | Tracking efficiency, concentration effects, user-defined parameters. | Polydisperse or complex samples. |
| Tunable Resistive Pulse Sensing (TRPS) | Particle-by-particle diameter & charge. | Mean: 110 nm ± 12 nm (SD, population skewness noted) | Pore calibration stability, analyte-pore interaction, pressure variation. | Detailed subpopulation analysis. |
Detailed Experimental Protocols for Cited Data
Protocol 1: DLS Measurement with Triplicate Uncertainty
- Sample Prep: Liposomal formulation diluted in filtered PBS (0.22 µm) to recommended scattering intensity.
- Instrument: Malvern Zetasizer Ultra.
- Settings: Temperature equilibrium at 25°C (2 min), 3 measurements per sample, automatic attenuation selection.
- Data Analysis: Z-average diameter and Polydispersity Index (PdI) recorded from intensity distribution. The standard deviation (SD) is calculated from three independent sample preparations. Report as: Z-avg = X.X nm ± Y.Y nm (SD, n=3); PdI = 0.0XX.
Protocol 2: TEM Image Analysis for Confidence Intervals
- Sample Prep: 5 µL of sample applied to carbon-coated grid, negatively stained with 2% uranyl acetate.
- Imaging: JEOL JEM-1400Flash, 10 random fields of view at 80,000x magnification.
- Particle Counting: Automated analysis using ImageJ with Trainable Weka Segmentation. Manual verification of threshold.
- Statistical Analysis: Diameters of ≥500 particles measured. A bootstrap resampling method (1000 iterations) is used to calculate the 95% confidence interval (CI) for the number-mean diameter.
Protocol 3: NTA Workflow for Prediction Intervals
- Instrument: Malvern NanoSight NS300.
- Capture: Three 60-second videos at camera level 14, syringe pump speed 20.
- Analysis: Detection threshold optimized per sample, constant for all replicates. All videos analyzed in NTA 3.4 software.
- Uncertainty Reporting: The mode is reported from the concentration-weighted size distribution. The 10th and 90th percentiles of the cumulative distribution provide a non-parametric prediction interval for the population spread.
Visualizing Uncertainty in the Sizing Workflow
Diagram Title: Sources of Uncertainty in Nanoparticle Sizing Workflow
The Scientist's Toolkit: Essential Research Reagent Solutions
| Item | Function in Uncertainty Quantification |
|---|---|
| NIST Traceable Size Standards (e.g., 60nm, 100nm polystyrene beads) | Provides instrument calibration baseline, reduces systematic error (bias) in measurements. |
| Filtered Buffer Solutions (0.1 µm or 0.22 µm syringe-filtered) | Minimizes dust/background particulate contamination, a major source of variability in light scattering. |
| Stable Control Formulation | A well-characterized, in-house nanoparticle batch used as a run-to-run control to monitor process variability. |
| Automated Image Analysis Software (e.g., ImageJ, ParticleMetric) | Reduces operator bias in microscopy-based sizing; enables high-throughput particle counting for robust statistics. |
| Statistical Software (e.g., R, Python with NumPy/SciPy) | Essential for calculating bootstrap confidence intervals, prediction intervals, and fitting complex distributions. |
Conclusion
Quantifying uncertainty is not an add-on but a fundamental component of rigorous nanoparticle characterization. By understanding foundational sources of variability, implementing robust methodological practices, proactively troubleshooting artifacts, and employing validation through orthogonal techniques, researchers can transform simple size measurements into reliable, decision-ready data. This systematic approach to uncertainty quantification is essential for advancing nanomedicines, enabling stronger correlations between physicochemical properties and biological performance, and ultimately satisfying the stringent demands of regulatory bodies for clinical translation. Future directions will involve greater automation of UQ workflows, advanced machine learning models for error prediction, and the development of more sophisticated, universally accepted reference materials.